GWAS of SARS-CoV-2 infection identifies ACE2 association
We performed GWAS of COVID-19 outcomes across 52,630 individuals with COVID-19 and 704,016 individuals with no record of SARS-CoV-2 infection aggregated from 4 studies (Geisinger Health System (GHS), Penn Medicine BioBank (PMBB), UK Biobank (UKB) and AncestryDNA; Supplementary Table 1) and 5 continental ancestries. Of the cases with COVID-19, 6,911 (13.1%) were hospitalized and 2,184 (4.1%) had severe disease; hospitalized patients were more likely to be older, of non-European ancestry and to have preexisting cardiovascular and lung disease (Supplementary Table 2). Using these data, we defined five case-control comparisons related to the risk of infection and two others related to disease severity among cases with COVID-19 (Table 1 and Supplementary Table 3). For each comparison, we performed ancestry-specific GWAS in each study using REGENIE (Methods) and then combined the results using a fixed-effects meta-analysis. Genomic inflation factors (λGC) for the meta-analyses were <1.05, suggesting no substantial impact of population structure or unmodeled relatedness (Supplementary Table 4). Unless otherwise noted, all association P values reported henceforth are from Firth (disease traits) or linear (quantitative traits) regression tests performed in REGENIE.
Our analysis provides independent support for several risk variants reported in previous GWAS of COVID-199,10,11 (Supplementary Table 5), including those recently reported by the COVID-19 Host Genetics Initiative (HGI)12, to which we contributed an earlier version of these data (Supplementary Table 6). Details for these replicated loci follow below, but first we looked for new genetic associations that might have been missed by the HGI. Across the seven risk and severity phenotypes, considering both common (minor allele frequency (MAF) > 0.5%, up to 13 million) and rare (MAF < 0.5%, up to 76 million) variants, we observed one previously unreported association at a conservative P < 8 × 10⁻¹¹ (Bonferroni correction for seven phenotypes × 89 million variants). This association was between a lower risk of SARS-CoV-2 infection (52,630 cases positive for COVID-19 versus 704,016 COVID-19 negative or unknown controls) and rs190509934:C on the X chromosome (MAF = 0.3%, odds ratio (OR) = 0.60, 95% confidence interval (CI) = 0.52–0.69, P = 4.5 × 10⁻¹³; Fig. 1). This rare variant is located 60 base pairs (bp) upstream of the ACE2 gene (Fig. 2a), the primary cell entry receptor for SARS-CoV-216.
a, Results for common variants (MAF ≥ 0.5%). b, Results for rare variants (MAF < 0.5%).
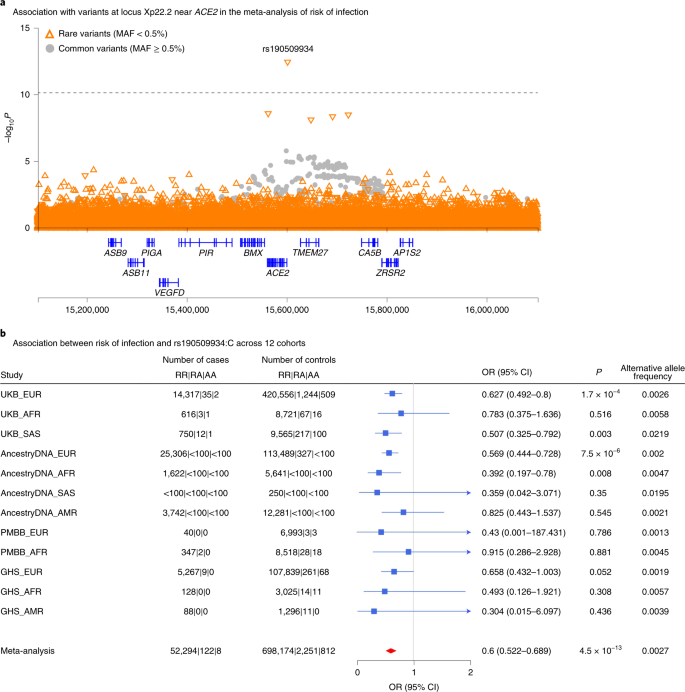
a, Regional association plot for locus Xp22.2 near ACE2 in the meta-analysis of risk of infection across 14 cohorts (n = 52,630 COVID-19-positive cases, n = 704,016 COVID-19-negative or unknown controls; Supplementary Table 4). b, Association between risk of infection and the most significant variant at the Xp22.2 locus (rs190509934:C, MAF = 0.3%) across 12 cohorts (n = 52,424 COVID-19-positive cases, n = 701,237 COVID-19-negative or unknown controls). The variant was not tested in two cohorts due to low sample size (AncestryDNA, EAS ancestry; UKB, EAS ancestry). Associations were estimated in each cohort using Firth regression (two-sided test) as implemented in REGENIE37, with results combined across cohorts using an inverse variance meta-analysis.
Given the potential significance of these findings, we studied the association between the ACE2 variant rs190509934 and COVID-19 outcomes in greater detail. We found that the variant was well imputed (imputation info score > 0.5 for all studies) and that there was no evidence for differences in effect size (heterogeneity test P > 0.05) across studies (Fig. 2b) or ancestries (Supplementary Table 7). However, a significantly stronger association with SARS-CoV-2 infection (heterogeneity test P = 0.009) was observed in males (OR = 0.49, P = 7.0 × 10⁻¹¹, explaining 0.085% of the variance in disease liability17, h2) when compared to females (OR = 0.72, P = 5 × 10⁻⁴; h2 = 0.017%). There were no associations between rs190509934 and 6 clinical risk factors for COVID-19 after multiple test correction (all with P > 0.05/6 = 0.008; Supplementary Table 8), suggesting these did not likely confound the analysis. We then investigated the association between rs190509934 and severity among cases with COVID-19 and found that carriers of rs190509934:C had a numerically (but not significantly) lower risk of worse disease outcomes when compared to non-carriers (for example, OR = 0.69, P = 0.16 when comparing 6,779 cases hospitalized with COVID-19 versus 44,968 cases not hospitalized with COVID-19; Supplementary Table 9). These results demonstrate that rs190509934 near ACE2 confers protection against SARS-CoV-2 infection and potentially also modulates disease severity among individuals infected with the virus; since the variant is relatively uncommon, a definitive account of its role in disease severity requires assessing larger numbers of severe cases.
We speculated that the protective rare variant near ACE2 (rs190509934:C) might regulate ACE2 expression. This variant was not characterized by the Genotype-Tissue Expression (GTEx) consortium18 or 51 other gene expression studies we queried (Supplementary Table 10). Thus, to test its association with ACE2 expression, we analyzed RNA sequencing (RNA-seq) data from liver tissue available in a subset of 2,035 individuals from the GHS study, including 8 heterozygous and 1 hemizygous carrier for rs190509934:C. After adjusting for potential confounders (for example, body mass index (BMI), liver disease), we found that rs190509934:C reduced ACE2 expression by 0.87 s.d. units (95% CI = −1.18 to −0.57, linear regression test P = 2.7 × 10⁻⁸; Fig. 3a). When considering raw, prenormalized ACE2 expression levels, rs190509934:C was associated with a 37% reduction in expression relative to non-carriers (Fig. 3b). There was no association with the expression of 8 other nearby genes (within 500 kilobases (kb), with detectable expression in our dataset) after accounting for multiple testing. These results are consistent with rs190509934:C lowering ACE2 expression, which in turn confers protection from SARS-CoV-2 infection.
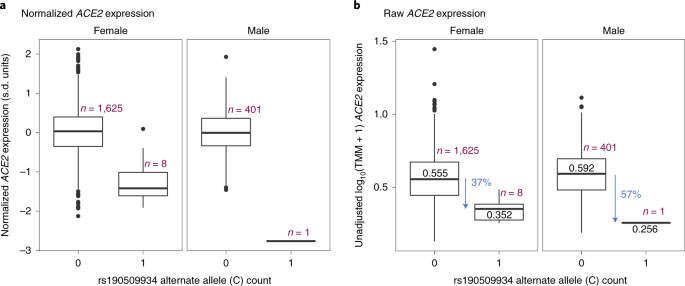
a, Association with normalized gene expression levels. b, Association with raw gene expression levels. The box plots show the median (center line), lower and upper quartiles (box boundaries), minimum and maximum (whiskers) and samples >1.5 s.d. units from the mean (individual data points).
In addition to its role in viral infections, the normal physiological role of ACE2 involves its hydrolysis and clearance of angiotensin II, a vasoconstrictive peptide that can lead to higher vascular tone or blood pressure19. Therefore, we investigated if rs190509934:C was associated with higher systolic blood pressure in the UKB study but found no significant association (Beta = 0.009 s.d. units, P = 0.56; Supplementary Table 11). There was a trend for higher blood pressure among carriers of ultrarare coding variants in ACE2 that are predicted to be full loss of function (Beta = 0.219 s.d. units, P = 0.09; Supplementary Table 11) and which were assayed through exome sequencing20. These results need to be confirmed in larger datasets but suggest that ACE2 loss of function may modestly increase blood pressure. This should be considered if ACE2 blockade is to be developed for COVID-19 treatment, although pharmacological inhibition of ACE2 in such a setting would be expected to be short term and elevations in blood pressure could be managed with antihypertensives. Of note, ACE2 expression in the airways was reported to be higher in smokers and patients with chronic obstructive pulmonary disease (COPD)21 and to increase with age22. Collectively, these observations and our genetic findings are consistent with the hypothesis that ACE2 levels play a key role in determining COVID-19 risk.
Replication of previously reported associations
As noted, our GWAS also identified associations at several loci reported in previous GWAS of COVID-19 outcomes. To explore previously reported signals in detail, we first attempted to replicate 8 independent associations (linkage disequilibrium (LD) r2 < 0.05) with disease risk (Supplementary Table 5) reported in 3 recent GWAS9,10,11 that included >1,000 cases (Supplementary Table 6). After accounting for multiple testing, 6 variants had a significant (P < 0.0012) and directionally consistent association in at least 1 of our 5 disease risk analyses (Supplementary Table 12): rs73064425:T in LZTFL1 (published OR = 2.14; strongest in our analysis of cases with severe COVID-19 versus COVID-19-negative or unknown controls; MAF = 7%, OR = 1.58, P = 2 × 10⁻¹⁸); rs2531743:G near SLC6A20 (published OR = 0.92; COVID-19-positive versus COVID-19-negative; MAF = 42%, OR = 0.94, P = 3 × 10⁻¹²); rs143334143:A in the major histocompatibility complex (MHC) (published OR = 1.85; COVID-19-positive versus COVID-19-negative; MAF = 7%, OR = 1.06, P = 2 × 10⁻⁴); rs879055593:T in ABO (published OR = 1.17; COVID-19-positive versus COVID-19-negative or unknown; MAF = 24%, OR = 1.10, P = 7 × 10⁻³⁴); rs2109069:A in DPP9 (published OR = 1.36; cases hospitalized with COVID-19 versus COVID-19-negative or unknown; MAF = 31%, OR = 1.10, P = 3 × 10⁻⁷); and rs2236757:A in IFNAR2 (published OR = 1.28; cases hospitalized with COVID-19 versus COVID-19-negative or unknown; MAF = 29%, OR = 1.08, P = 7 × 10⁻⁵). The variants in LZTFL1 and SLC6A20 are located 63 kb apart at the 3p21.31 locus first reported by Ellinghaus et al.9, which contains a core risk haplotype that includes 13 variants in high LD with each other23. However, in individuals of European ancestry, this haplotype block (indexed by rs35044562) is in high LD with the LZTFL1 variant rs73064425 (r2 = 0.99) but not the SLC6A20 variant rs2531743 (r2 = 0.02), indicating that these two signals—for severe COVID-19 among infected individuals and for risk of SARS-CoV-2 infection compared with individuals who did not test positive for COVID-19, respectively—are likely independent.
There was no evidence for heterogeneity in effect sizes across studies (all with P > 0.05; Supplementary Table 12) or ancestries (all with P > 0.05; Supplementary Table 13) for any of the six variants. We also explored the possibility that the association between these six variants and COVID-19 could have been confounded by disease status for relevant comorbidities. We found that only two of the six variants were associated with a clinical risk factor: the MHC variant was associated with asthma (P = 6.8 × 10⁻⁹) and type 2 diabetes (T2D) (P = 1.5 × 10⁻⁵), while the ABO variant was associated with kidney disease (P = 1.4 × 10⁻⁴) and T2D (P = 9.7 × 10⁻⁵; Supplementary Table 8). Importantly, however, for both variants the association with COVID-19 was essentially unchanged after adjusting for the associated clinical risk factors (MHC: OR = 1.09 versus OR = 1.08; ABO: OR = 1.08 versus OR = 1.07; Supplementary Table 14). Therefore, we conclude that the association between the six variants and COVID-19 is unlikely to be explained by these underlying comorbidities.
Associations with disease severity among cases with COVID-19
We then investigated which replicated variants were associated with severity among cases with COVID-19. Among the 6 replicated variants (in/near LZTFL1, SLC6A20, MHC, ABO, DPP9 and IFNAR2), 4 were significantly (P < 0.05) associated with worse outcomes among infected individuals (in/near LZTFL1, MHC, DPP9 and IFNAR2), while those in ABO and near SLC6A20 were not associated with COVID-19 severity (Extended Data Fig. 1 and Supplementary Table 15). Collectively, these results highlight four variants associated with both COVID-19 risk and worse disease outcomes, including respiratory failure and death. These variants may be used to identify individuals at risk of severe COVID-19 and guide the search for genes involved in the pathophysiology of COVID-19.
Next, we evaluated whether variants identified by the COVID-19 HGI, a large worldwide effort to identify genetic risk factors for COVID-19, could augment this set of four disease severity variants. The latest HGI analyses12 include data from 49,562 individuals infected with SARS-CoV-2 and use >1.7 million individuals with no record of infection as controls (Supplementary Table 16). To identify additional variants associated with severity, we started with variants associated with the phenotype ‘reported infection’ (infected versus no record of infection) which, despite the sample overlap between the HGI and our analyses, was statistically independent from severity among infected individuals because infection status (positive cases versus negative or unknown controls) is uncorrelated with hospitalization status once infected (hospitalized versus non-hospitalized cases). We found that two variants were nominally associated with the risk of severe disease among cases (rs11919389 near RPL24, P = 0.029 and rs1886814 near FOXP4, P = 0.018; Supplementary Table 16), suggesting that these loci also modulate disease severity after infection with SARS-CoV-2.
Likely effector genes of variants associated with COVID-19
Collectively, our association analyses highlighted six common variants identified in previous GWAS or by the HGI—in/near LZTFL1, MHC, DPP9, IFNAR2, RPL24 and FOXP4—that are associated with COVID-19 as well as disease severity among cases. To help identify genes that might underlie the observed associations, we searched for functional protein-coding variants (missense or predicted loss of function) in high LD (r2 > 0.80) with each variant. We found eight functional variants in five genes (Supplementary Table 17): IFNAR2, a cytokine receptor component in the antiviral type 1 IFN pathway, which is activated by SARS-CoV-2 and is dysregulated in cases with severe COVID-1914,24); CCHCR1, a P-body protein associated with cytoskeletal remodeling and messenger RNA turnover25,26; TCF19, a transcription factor associated with hepatitis B27; and C6orf15 and PSORS1C1, two functionally uncharacterized genes in the MHC. These data indicate that the variants identified may have functional effects on these five genes.
We then asked if any of the 6 sentinel variants colocalized (that is, were in high LD, r2 > 0.80) with published sentinel expression quantitative trait loci (eQTLs) across 52 studies (considering eQTLs associated with gene expression at a P < 2.5 × 10⁻⁹ in the original studies; Supplementary Table 10), specifically focusing on 114 genes in cis (±500 kb). We found colocalization with sentinel eQTLs for eight genes (Supplementary Table 18): SLC6A20 (eQTLs from lung), a proline transporter that binds the host SARS-CoV-2 receptor, ACE228; NXPE3 (esophagus), a gene of unknown function; SENP7 (blood), a SUMO-specific protease that promotes IFN signaling and that in mice is essential for innate defense against herpes simplex virus 1 infection29; IFNAR2 and TCF19 (multiple tissues), both discussed above; LST1 (blood), an immunomodulatory protein that inhibits lymphocyte proliferation30 and is upregulated in response to bacterial ligands31; HLA-C (adipose tissue), a natural killer cell ligand, which is associated with HIV infection32 and autoimmunity33; and IL10RB (multiple tissues), a pleiotropic cytokine receptor associated with persistent hepatitis B and autoimmunity34,35. Collectively, analysis of missense variation and eQTL catalogs suggests 12 potential effector genes in COVID-19 loci (ACE2, C6orf15, CCHCR1, HLA-C, IFNAR2, IL10RB, LST1, NXPE3, PSORS1C1, SENP7, SLC6A20 and TCL19), although functional studies are required to confirm these predictions.
Using GRS to predict severe disease
Next, we proceeded to evaluate if common genetic variants can help identify individuals at high risk of severe COVID-19 once infected with SARS-CoV-2. To this end, we created a weighted GRS for individuals with a record of SARS-CoV-2 infection and then compared the risk of hospitalization (hospitalized versus non-hospitalized cases) and severe disease (severe versus non-hospitalized cases) between those with a high GRS and all other cases, after adjusting for established risk factors. We considered different approaches to select variants for inclusion in the GRS. First, we reasoned that variants most informative for prediction of severe disease were those associated with worse disease outcomes among infected individuals; thus, this was the approach taken for our primary GRS analysis. Of all published genetic risk factors for COVID-19, only one variant was associated with worse outcomes among infected individuals at P < 5 × 10⁻⁸ in our analysis (rs73064425 in LZTFL1) but this likely reflects low power due to the small number of patients with severe illness that were available for analysis. To address this limitation, we also included in the GRS five additional variants (in/near MHC, DPP9, IFNAR2, RPL24 and FOXP4) that (1) had an association with risk of infection at P < 5 × 10⁻⁸ in published GWAS or by the HGI; and (2) were associated with worse disease outcomes among infected individuals in our data (Supplementary Tables 15 and 16), albeit at the suggestive level with current sample sizes. The combination of a genome-wide significant association with risk of infection in previous GWAS and a suggestive association with worse outcomes among infected individuals in the current analysis minimizes the chance that these loci represent false positive associations for disease severity. Of note, we did not include in the GRS five additional variants discovered by the HGI for risk of hospitalization or severe disease (Supplementary Table 16) because the HGI analysis for those two phenotypes was not statistically independent from our analysis of disease outcomes among infected individuals (due to sample overlap). To calculate the GRS, the weights used for each of the six variants corresponded to the effect size (log of the OR) reported in previous GWAS. P values reported in this section were obtained from a logistic regression test (Methods), unless otherwise noted.
When considering cases with COVID-19 of European ancestry (n = 44,958), we found that having a high GRS (top 10%) was associated with a 1.38-fold increased risk of hospitalization (95% CI = 1.26–1.53, P = 6 × 10⁻¹¹; Fig. 4a) and 1.58-fold increased risk of severe disease (95% CI = 1.36–1.82, P = 7 × 10⁻¹⁰; Fig. 4b). In other ancestries, a high GRS also appeared to predict risk of hospitalization—including among individuals of African ancestry (n = 2,598, 1.70-fold risk for high GRS, 95% CI = 1.03–2.81, P = 0.038), Hispanic or Latin American ancestry (n = 3,752, 1.56-fold risk, 95% CI = 1.00–2.43, P = 0.05) and South Asian ancestry (n = 760, 1.42-fold risk, 95% CI = 0.72–2.82, P = 0.32; Supplementary Table 19). A similar pattern was observed in non-European ancestries for risk of severe disease, although sample sizes were considerably smaller (Supplementary Table 20).
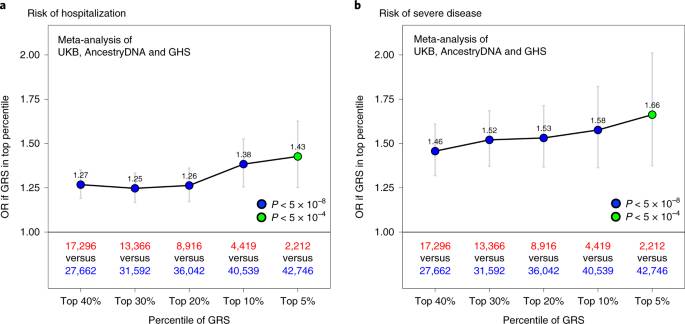
a, Association between a high GRS and risk of hospitalization. The risk of hospitalization among cases is shown for individuals in the top GRS percentile, agnostic to the number of clinical risk factors present. The association was tested in three studies separately (AncestryDNA, UKB and GHS) using logistic regression (two-sided test), with established risk factors for COVID-19 included as covariates (Methods). Results were then meta-analyzed across studies (combined n = 44,958 cases with COVID-19, including 6,138 hospitalized). b, Association between a high GRS and risk of severe disease. The association was tested as described above in three studies separately (AncestryDNA, UKB and GHS). Results were then meta-analyzed across studies (combined n = 44,958 cases with COVID-19, including 1,940 with severe disease). n in red: number of cases with COVID-19 in the top GRS percentile. n in blue: number of cases with COVID-19 in the rest of the population. Data are presented as OR ± 95% CIs. Association statistics, including exact P values, are shown in Supplementary Table 20.
We then compared the effect of the GRS between individuals with and without established risk factors for severe COVID-19. In Europeans of both the AncestryDNA and UKB studies, we found that a high GRS (top 10%) was associated with risk of severe disease both among individuals with and without established clinical risk factors for severe COVID-19 (Fig. 5). In the meta-analysis of the two studies, a high GRS was associated with a 1.65-fold (95% CI = 1.39–1.96, P = 1 × 10⁻⁸) and 1.75-fold (95% CI = 1.28–2.40, P = 4 × 10⁻⁴) higher risk of severe disease, respectively among individuals with (n = 22,045) and without (n = 22,913) established risk factors (Supplementary Table 21), with no evidence for heterogeneity of GRS effect with clinical risk factor status (P = 0.30). Similar results were observed for risk of hospitalization (1.35-fold versus 1.39-fold; Supplementary Table 21 and Extended Data Fig. 2). We also performed this stratified analysis in individuals of Hispanic or Latin American ancestry (but not other ancestries due to small sample size) and found that a high GRS was associated with higher risk of severe disease in individuals with (n = 1,341; OR = 3.35, 95% CI = 1.56–7.21, P = 0.002) but not without (n = 2,411; OR = 0.88, 95% CI = 0.19–4.07, P = 0.873) clinical risk factors (Extended Data Fig. 3).
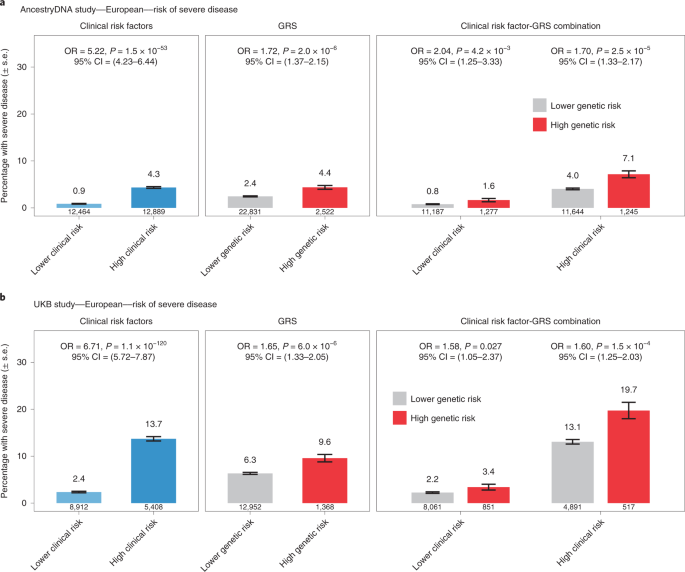
a, Rate of severe disease in the AncestryDNA study (n = 25,353 cases with COVID-19, including 667 with severe disease). b, Rate of severe disease in the UKB study (n = 14,320 cases with COVID-19, including 951 with severe disease). High genetic risk (red bars): top 10% of the GRS. Low genetic risk (gray bars): bottom 90% of the GRS (that is, all other cases with COVID-19). The association between risk of severe disease and risk factors (for example, clinical risk factors) was estimated using logistic regression (two-sided test). Data are presented as the percentage of individuals with severe disease ± s.e.
Next, we performed sensitivity analyses to understand the extent to which the GRS composition affected the association results described above. First, we expanded the GRS to include all 12 variants reported to associate with the risk of COVID-19 in previous GWAS (8 variants) and by the HGI (4 new variants associated with reported infection). We found that associations between the 12-SNP GRS and both risk of hospitalization and severe disease were similar to those obtained with the 6-SNP GRS (Extended Data Fig. 4). For example, using the 12-SNP GRS, we found that cases with COVID-19 in the top 10% of genetic risk had a 1.38-fold (95% CI = 1.26–1.52, P = 4 × 10⁻¹¹) and 1.64-fold (95% CI = 1.43–1.90, P = 6 × 10⁻¹²) higher risk of severe disease, compared to 1.38-fold and 1.58-fold, respectively obtained with the 6-SNP GRS (above). Second, we expanded the GRS to include a larger set of variants associated with risk of infection but this resulted in weaker associations when compared to the 6-SNP GRS (Extended Data Fig. 5). Overall, these results suggest that a GRS calculated using variants associated with disease risk and severity can potentially be used to identify cases with COVID-19 at high risk of developing poor disease outcomes.
To formally address this possibility, we assessed the value of using the 6-SNP GRS to predict the risk of severe disease in addition to demographic and clinical risk factors. For this analysis, each study was split 50:50 into a training set, which was used to estimate associations between disease severity and demographic, clinical and genetic risk factors, and a validation set, where risk scores were calculated based on the effect estimates from the training set and then used to predict disease severity (Methods). We found that the ability to predict disease severity improved somewhat when the 6-SNP GRS was added to a baseline model that considered only age and sex, with the area under the receiving operator characteristic curve (AUC) improving by 0.7% in the AncestryDNA study and 0.5% in the UKB study (Fig. 6). This magnitude of improvement in the AUC was comparable to that observed with some clinical risk factors individually, such as cardiovascular disease (CVD) (0.6% and 0.5%, respectively in AncestryDNA and UKB) and respiratory disease (1% and 0.8%, respectively). Similar results were observed when the 6-SNP GRS was added to a model that considered all non-genetic risk factors (Fig. 6), with the AUC for disease severity improving by 0.8% and 0.5%, respectively in the AncestryDNA and UKB studies. Overall, in our analyses, age and sex were the strongest predictors of poor outcomes in individuals with COVID-19 and an elevated GRS enabled a modest improvement in predictions similar to that contributed by individual clinical risk factors.
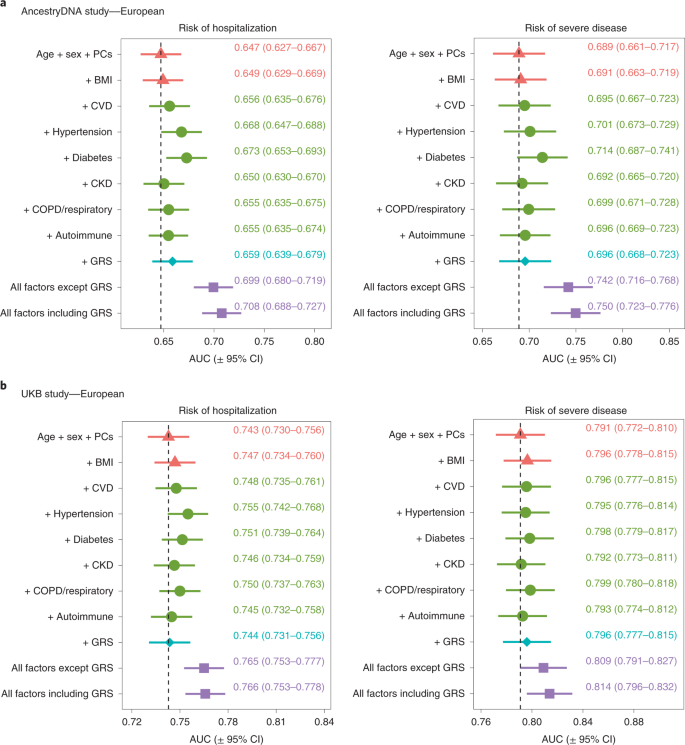
We tested the extent to which information on genetic risk (specifically the 6-SNP GRS) could help predict risk of hospitalization and severe disease in addition to demographic and clinical risk factors. a, Results for the AncestryDNA study (n = 25,353 cases with COVID-19). b, Results for the UKB study (n = 14,320 cases with COVID-19). Each study was split 50:50 intro training and validation sets, with prediction accuracy in the validation set summarized in each plot by the AUC. Data are presented as the AUC ± 95% CI. The vertical dashed line shows the AUC for the baseline model (age + sex + PCs).