Priced right, any home will sell. But sellers are not wanting to price their homes right.
By Wolf Richter for WOLF STREET.
This is getting relentless: Sales of previously owned houses, condos, and co-ops fell by 1.5% in December from November, the 11th month in a row of month-to-month declines, and by 34% year-over-year, to a seasonally adjusted annual rate of sales of 4.02 million homes, roughly matching the lockdown-low in May 2020, and beyond that the lowest since the depth of Housing Bust 1 in 2010, according to the National Association of Realtors today.
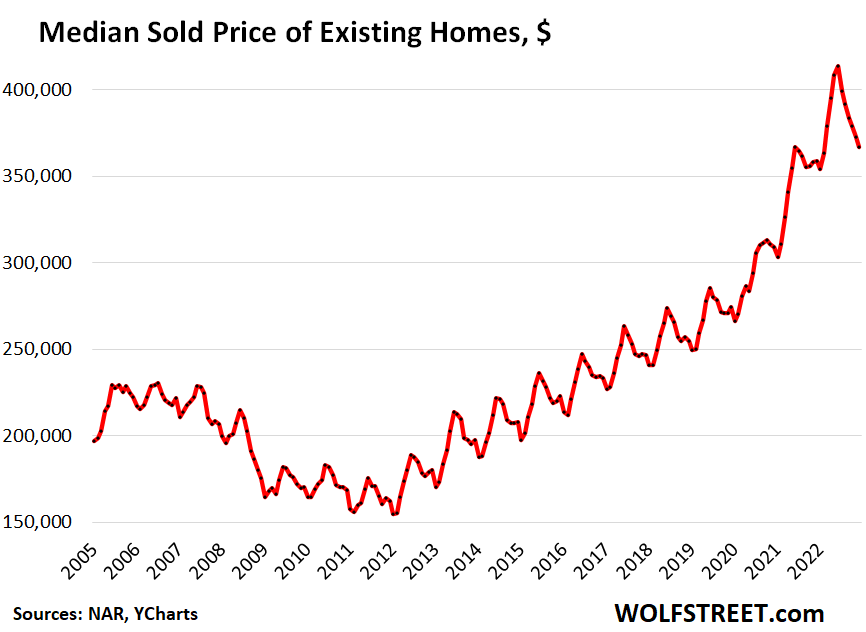
Priced right, just about any home will sell, but sellers are not wanting to price their homes right. And potential sellers are sitting on their vacant homes, hoping for a quick end to this downturn, or they’re putting it on the rental market or try to make a go of it as a vacation rental, rather than dealing with the reality of a mind-blowing housing bubble that has loudly popped (historic data via YCharts):
Actual sales in December – not the “seasonally adjusted annual rate” of sales – fell 36.3% year-over-year, to 326,000 homes (from 513,000 homes a year ago), according to the NAR.
The median price of all types of homes whose sales closed in November fell for the sixth month in a row, to $366,900, down 11.3% from the peak in June. This drop whittled down the year-over-year gain to just 2.3%, from a year-over-year gain of 16% in the spring of 2022.
Only a portion of this June-December price drop is seasonal: The average June-December decline over the six years before the pandemic was 5.8%, with a maximum decline of 6.4% and a minimum decline of 3.8%. This shows that the current 11.3% decline goes well beyond even the maximum seasonal decline.
Additional confirmation that much of this decline was not seasonal is provided by the rapidly shrinking year-over-year price gain, down to just 2.3%, from 16% in December 2021 through the spring of 2022 (historic data via YCharts):
In some markets, the median price has plunged a lot further. For example, in the San Francisco Bay Area, the median price has plunged by 30% from the peak in April 2022, and by 10% year-over-year, according to the California Association of Realtors. But other markets are lagging behind, to produce the overall national average.
All-cash buyers, investors, and second home buyers pulled back massively. All-cash sales plunged by 22% year-over-year, to 92,000 homes (28% of the 328,000 homes sold), down from 118,000 in December 2021 (23% of 513,000 homes sold). In other words, buyers that pay cash didn’t want to buy these overpriced homes either, though they didn’t have to worry about getting a high-rate mortgage.
Sales to individual investors or second home buyers plunged by 27% to 52,500 homes (16% of 328,000 homes sold), from 71,800 in December 2021 (14% of 513,000 homes sold). They too pulled back from this market.
Sales of single-family houses fell by 1.1% in December from November, and by 33.5% year-over-year, to a seasonally adjusted annual rate of 3.64 million houses.
Sales of condos and co-ops fell by 4.5% in December from November, and by 38.2% year-over-year, to a seasonally adjusted annual rate of 420,000 units.
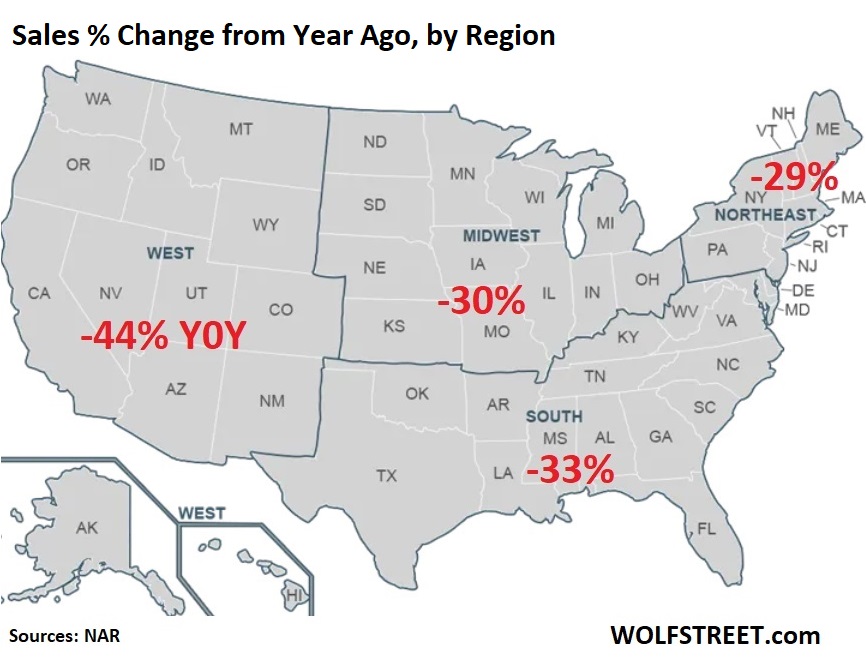
Sales plunged in all regions, but plunged the most in the West. Year-over-year percent change (NAR map of regions):
Active listings jumped by 55% from a year ago, to 68,900 in December (active listings = total inventory for sale minus properties with pending sales). Just before the holidays, lots of sellers pull their homes off the market, and then put them back on the market for the spring selling season. This happens every year; active listing start to drop before Thanksgiving and don’t rise again until the spring (data via realtor.com):
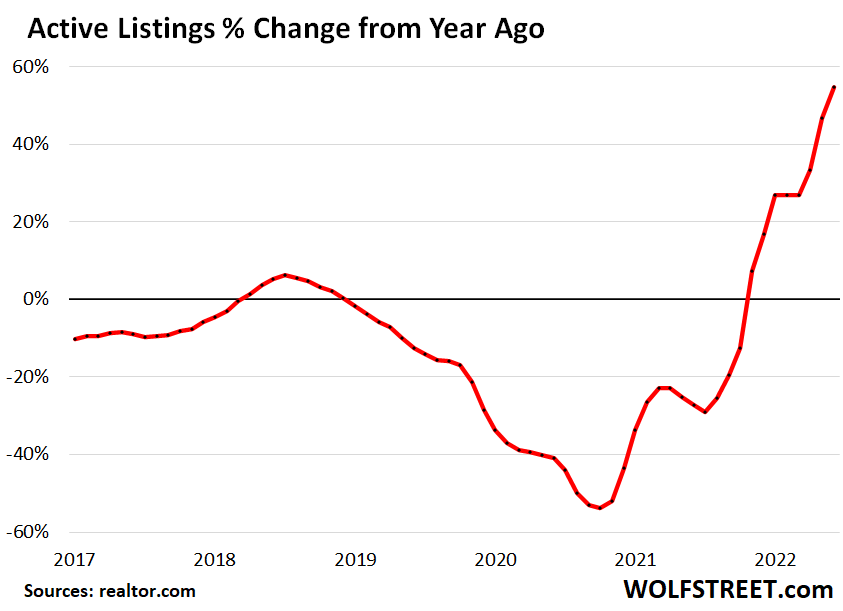
Active listings, though up hugely from a year ago, are still relatively low as potential sellers are determined to wait out what they expect to be a brief ripple in the market, and meanwhile they’re putting their vacant homes on the rental market and they’re trying to bring in some cash by putting their vacant home out there as a vacation rental. And many are just sitting on their vacant homes that they hadn’t sold because they’d wanted to ride up the market all the way to the top with huge gains of 20% or 30% a year. But that show is over. And now what?
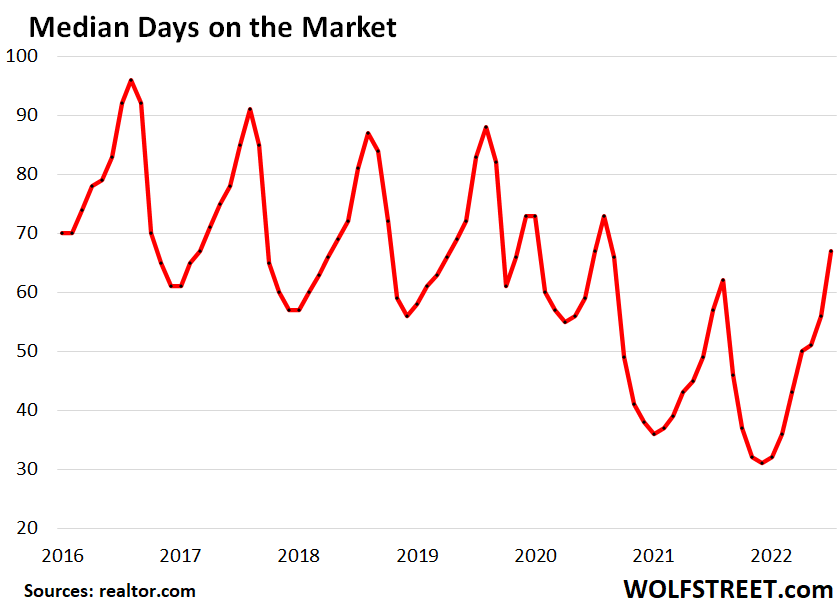
Median days on the market, before the frustrated seller pulls the home off the market, or before the home is sold, rose to 67 days (data via realtor.com):
Price reductions: Active listings with price reductions hit a new high for any December in the data by realtor.com going back to 2016: 25% of the active listings in December 2022 had price reductions, up from for example 17% in the pre-pandemic December 2019.
December or January is usually the seasonal low point for price reductions. Rather than cutting prices, many sellers pull their homes off the market and wait for the spring selling season, before they re-list it. That sellers are cutting prices over the holidays to this extent shows that they’re getting a little more aggressive.
Hoping for a quick reversal of this downturn: This combination of plunging sales, dropping prices, rising active listings, rising days on the market before the home gets pulled or sold, an increase of active listings with price cuts, but still tight supply, indicates that many potential sellers are still hoping for a quick reversal of this downturn. And they’re letting the vacant home sit to wait for better days, or they’re putting it on the rental market or try to make a go of it as a vacation rental, rather than dealing with the reality of a mind-blowing housing bubble that has loudly popped.
Enjoy reading WOLF STREET and want to support it? You can donate. I appreciate it immensely. Click on the beer and iced-tea mug to find out how:

Would you like to be notified via email when WOLF STREET publishes a new article? Sign up here.
![]()