Now it’s new vehicles, restaurants, energy. Game of Whac-A-Mole as some price spikes slow while others begin. But it’s a lot worse than it seems.
By Wolf Richter for WOLF STREET.
The Consumer Price Index (CPI) jumped 0.5% in July from June, after having jumped 0.9% in June, 0.6% in May, for a three-month annualized rate – the three-month momentum – of 8.1%. Year-over-year, CPI jumped 5.4%, same pace as in June, and the fastest since June 2008 (5.6%), all of which had been the fastest since January 1991, according to data released by the Bureau of Labor Statistics today.
The CPI without the volatile food and energy components (“core CPI”) rose by 0.3% for the month and by 4.3% year-over-year.
The CPI measures the loss of the purchasing power – well, part of the loss of the purchasing power, as we’ll see in a moment – of the consumer dollar and thereby the purchasing power of labor. In July, this purchasing power dropped another 0.5% for the month, and for the past three months annualized, it dropped by 8.6% – “Honey, where did my big raise go?”
CPI vastly understates one-third of its components: housing cost.
Homeownership costs and rents account for 31% of CPI. These are the largest categories, the most important categories, but they hardly budged despite exploding housing costs and thereby suppressed the CPI.
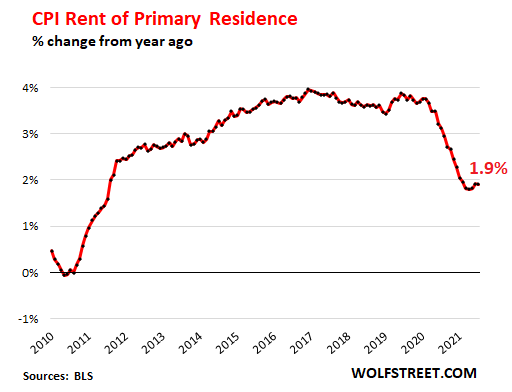
“Rent of primary residence,” which weighs 7.6% in the overall CPI, ticked up just 1.9% year-over-year despite the chaos going on in the rental market, as many cities experienced double-digit rent increases, while others experienced declines. Every month this year, it nudged up 0.2% from the prior month as if nothing had happened. This is the CPI for rent, which has dropped from the 4% range in 2019 to 1.9%:
“Owners’ equivalent rent of residences” – the component that tracks the costs of homeownership and weighs 23.6% in the overall CPI – rose just 2.4% year-over-year despite the historic price explosion in the housing market.
The CPI’s homeownership component doesn’t track actual home-price inflation, but it is based on surveys that ask what homeowners think their home might rent for and is therefore a measure of rent as seen by the homeowner.
Meanwhile, back at the ranch, the national median price of existing homes spiked by 23.4% year-over-year, according to the National Association of Realtors.
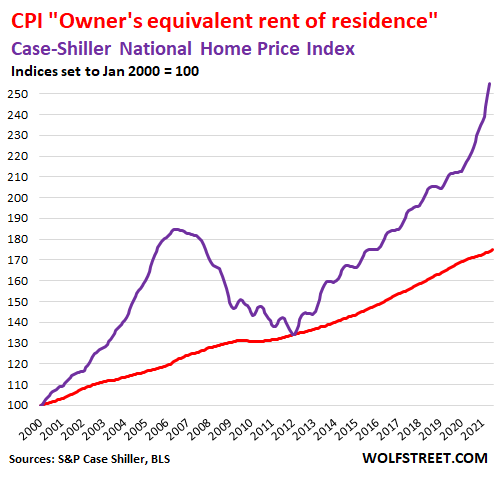
The Case-Shiller Home Price Index, which tracks the price changes of the same house and is therefore a measure of house price inflation, spiked by 16.6% year-over year, the most in the data going back to 1987 (purple line). And yet, the measure for the costs of homeownership by the BLS barely budged (red line):
Energy costs spiked 23.8% year-over-year.
Energy accounts for 7.2% of the overall CPI. The spike was driven by gasoline, a surprise to no one who has filled up a tank of gas recently, which jumped 41.8% year-over-year. Natural gas jumped 19% year-over-year. The CPI for electricity service to the home rose 4.0% year-over-year.
Durable Goods inflation spiked 14.3% year-over-year, along with June the biggest since at least 1957.
The crazy new and used vehicle prices drove, so to speak, the spike in the CPI for durable goods. Other items in this category are appliances, consumer electronics, furniture, tools, bicycles, sports equipment, etc. The CPI for durable goods spiked by 14.3% year-over-year, after having spiked by 14.6% in June, both of which were the biggest jumps in the data going back to 1957.
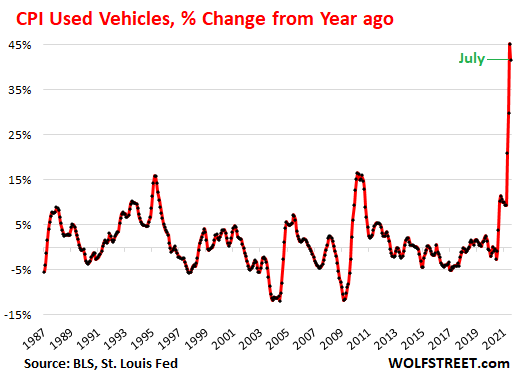
The CPI for used vehicles jumped by 0.8% in July, but given the crazy spike that began last summer, July’s jump was a lot smaller than the jump in July last year. And on a year-over-year basis – due to this base effect – it spiked a tad less than in June, but by a still mind-bending 41.7%. Not much comfort yet for used vehicle shoppers, but price resistance has finally started to crop up and a portion of this crazy price spike is going to unwind:
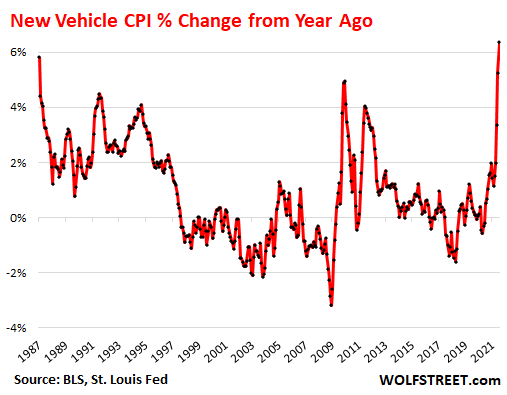
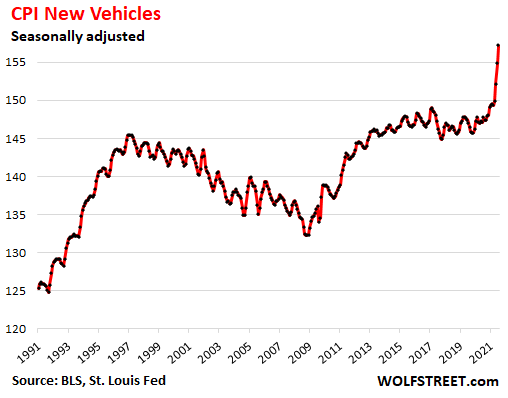
New Vehicle CPI spikes the most since 1982, even as the used vehicle CPI’s spike is slowing. This is the game of inflation Whac-A-Mole, where one price spike here is replaced by another price spike there.
The CPI for new cars and trucks jumped by 1.5% in July, the third month in a row of these types of price spikes, the biggest since the cash-for-clunkers program during the Great Recession. This brought the year-over-year spike to 6.4%, the fastest since January 1982. But as we’ll see in a moment that price spike is understated by “hedonic quality adjustments.”
“Hedonic quality adjustments” suppress the CPIs for new & used vehicles. The BLS uses “hedonic quality adjustments” to account for improvements in vehicles over the years. For example, the estimated added costs of the decades-long transition from a four-speed automatic transmission to a 10-speed electronically controlled transmission are removed from the CPI at every step along the way. For an illustration what that means, here is my real-world F-150 and Camry price index compared to this CPI for new vehicles going back to 1989.
In theory, CPI measures price changes of the same item over time; and any improvements change the item, which then boils down to a price increase based on an improvement rather than just the loss of the purchasing power of the dollar. In theory, this makes sense.
In practice, these hedonic quality adjustments have been aggressively applied to push down the CPI, and thereby suppress the appearance of inflation. Under-reporting the loss of the purchasing power of the dollar is a convenient political thing, an effort to keep workers in the dark about the purchasing power of their labor.
The effect can be seen in the new vehicle CPI as an index, which shows that new vehicle prices fell in the years after hedonic quality adjustments took effect, and that in 2019, you could have bought a Camry or an F-150 for the same price as in 2000, which is of course a total farce. It’s only the recent spike that outran the hedonic quality adjustments, but it too will eventually be reeled in by them.
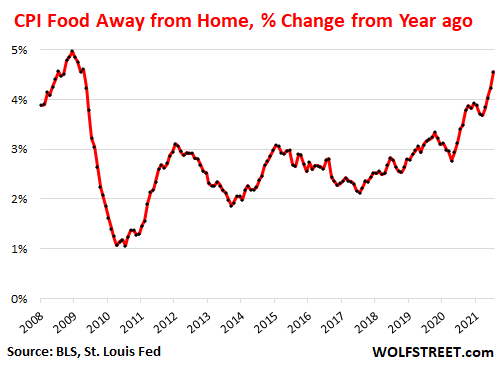
Restaurant prices are next in the inflation Whac-a-Mole.
Everyone who has been eating out or has followed the announcements by the fast-food chains knows that this has been happening, and it is now working itself ever so gradually into the CPI for “Food away from home,” which jumped by 0.8% in July from June, after having jumped 0.7% in June and 0.6% in May. Year-over-year, the index is up 4.6%, the most since 2009. But this is just the beginning.
Restaurants, struggling to hire workers, have increased their wages, and they also face increases in the costs of commodities, ingredients, and services they use, and they face higher operating costs due to the pandemic, and they’ve begun to pass those costs on to consumers:
This loss of purchasing power is “permanent.”
Only a period of deflation – with prices across the board actually dropping – would recuperate the purchasing power of the dollar. But that won’t be allowed. In my lifetime, there were only a few quarters of deflation. The rest of the time, it was either inflation or rampant inflation. And now, after a period of inflation, we’ve got rampant inflation. As the first chart above shows, the loss of purchasing power isn’t “transitory” or “temporary” but rock-solid permanent. What is transitory is the pace of the future losses of purchasing power.
Enjoy reading WOLF STREET and want to support it? Using ad blockers – I totally get why – but want to support the site? You can donate. I appreciate it immensely. Click on the beer and iced-tea mug to find out how:

Would you like to be notified via email when WOLF STREET publishes a new article? Sign up here.
![]()