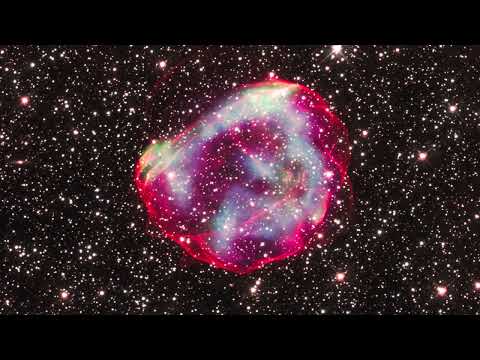
Astronomers combined X-ray data from Chandra with those from other telescopes to determine how long ago the star in the supernova remnant called SNR 0519-69.0 exploded and learn about the environment the supernova occurred in. These images show X-ray data from Chandra and Hubble’s optical data of the remnant’s perimeter and surrounding stars. Astronomers concluded that the white dwarf that created this remnant exploded no more than about 670 years ago as seen from Earth. Credit: X-ray: NASA/CXC/GSFC/B. J. Williams et al.; Optical: NASA/ESA/STScI
- A new image of SNR 0519-69.0 shows the debris of a star that exploded several hundred years ago in Earth’s timeframe.
- The explosion of a

Although astronomers have seen the debris from numerous exploded stars in the
Supernova remnant SNR 0519-69.0 (called SNR 0519 for short) is the debris from an explosion of a white dwarf star. After reaching a critical mass, either by merging with another white dwarf or pulling matter from a companion star, the star underwent a thermonuclear explosion and was destroyed. Scientists use this type of supernova, called a Type Ia, for a wide range of scientific studies ranging from studies of thermonuclear explosions to measuring distances to galaxies across billions of light-years.

Optical image of SNR 0519-69.0. Credit: NASA/ESA/STScI
SNR 0519 is in the Large Magellanic Cloud, a small galaxy located about 160,000 light-years from Earth. This composite image (top of the page) shows X-ray data from NASA’s Chandra X-ray Observatory and optical data from NASA’s
Low Energy X-ray image of SNR 0519-69.0. Credit: NASA/CXC/GSFC/B. J. Williams et al.
Astronomers combined the data from Chandra and Hubble with data from NASA’s retired Spitzer Space telescope to determine how long ago the star in SNR 0519 exploded. They were also able to learn about the environment the supernova occurred in. This data provides scientists a chance to “rewind” the movie of the stellar evolution that has played out since and figure out when it got started.
Medium Energy X-ray image of SNR 0519-69.0. Credit: NASA/CXC/GSFC/B. J. Williams et al.
The researchers compared Hubble images from 2010, 2011, and 2020 to measure the speeds of material in the blast wave from the explosion, which range from about 3.8 million (6 million kilometers) to 5.5 million miles (9 million kilometers) per hour. If the speed was toward the upper end of those estimated speeds, the astronomers determined that light from the explosion would have reached Earth about 670 years ago. This would have been during the Hundred Years’ War between England and France and the height of the Ming dynasty in China.
High Energy X-ray image of SNR 0519-69.0. Credit: NASA/CXC/GSFC/B. J. Williams et al.
However, it’s likely that the material has slowed down since the initial explosion. There, the explosion would have happened more recently than 670 years ago. The Chandra and Spitzer data provide clues that this is the case. Astronomers found the brightest regions in X-rays of the remnant are where the slowest-moving material is located, and no X-ray emission is associated with the fastest-moving material.
These results imply that some of the blast wave has crashed into dense gas around the remnant, causing it to slow down as it traveled. Astronomers may use additional observations with Hubble to determine more precisely when the time of the star’s demise should truly be set.
Reference: “Evidence for a Dense, Inhomogeneous Circumstellar Medium in the Type Ia SNR 0519-69.0” by Brian J. Williams, Parviz Ghavamian, Ivo R. Seitenzahl, Stephen P. Reynolds, Kazimierz J. Borkowski and Robert Petre, 18 August 2022, The Astrophysical Journal.
DOI: 10.3847/1538-4357/ac81caA paper describing these results was published in the August issue of The Astrophysical Journal. The authors of the paper are Brian Williams (NASA’s Goddard Space Flight Center (GSFC) in Greenbelt, Maryland); Parviz Ghavamian (Towson University, Towson, Maryland); Ivo Seitenzahl (University of New South Wales, Australian Defence Force Academy, Canberra, Australia); Stephen Reynolds (