If we’ve learned anything from the COVID-19 pandemic, it’s that we cannot wait for a crisis to respond. Science and AAAS are working tirelessly to provide credible, evidence-based information on the latest scientific research and policy, with extensive free coverage of the pandemic. Your tax-deductible contribution plays a critical role in sustaining this effort.
These images show the diversity of black hole jets. Left: NGC 1068, one of the nearest and brightest galaxies (green and red) with a rapidly growing supermassive black hole, powers a jet (blue) much smaller than the galaxy itself. Credit: NASA/CXC/MIT/C.Canizares, D.Evans et al. (X-ray); NASA/STScI (optical); and NSF/NRAO/VLA (radio). Right: The galaxy Centaurus A reveals particle jets extending far above and below the galaxy’s disk. Credit: ESO/WFI (optical); MPIfR/ESO/APEX/A.Weiss et al. (submillimeter); and NASA/CXC/CfA/R. Kraft et al. (X-ray).
Leveraging the NASA Center for Climate Simulation (NCCS), NASA Goddard Space Flight Center scientists ran 100 simulations exploring jets—narrow beams of energetic particles—that emerge at nearly light speed from supermassive black holes. These behemoths sit at the centers of active, star-forming galaxies like our own Milky Way galaxy, and can weigh millions to billions of times the mass of the sun.
As jets and winds flow out from these active galactic nuclei (AGN), they “regulate the gas in the center of the galaxy and affect things like the star-formation rate and how the gas mixes with the surrounding galactic environment,” explained study lead Ryan Tanner, a postdoc in NASA Goddard’s X-ray Astrophysics Laboratory.
“For our simulations, we focused on less-studied, low-luminosity jets and how they determine the evolution of their host galaxies.” Tanner said. He collaborated with X-ray Astrophysics Laboratory astrophysicist Kimberly Weaver on the computational study, which appears in The Astronomical Journal.
New simulations carried out on the NASA Center for Climate Simulation (NCCS) Discover supercomputer show how weaker, low-luminosity jets produced by a galaxy’s monster black hole interact with their galactic environment. Because these jets are more difficult to detect, the simulations help astronomers link these interactions to features they can observe, such as various gas motions and optical and X-ray emissions. Credit: NASA’s Goddard Space Flight Center.
Observational evidence for jets and other AGN outflows first came from radio telescopes and later NASA and European Space Agency X-ray telescopes. Over the past 30 to 40 years, astronomers including Weaver have pieced together an explanation of their origin by connecting optical, radio, ultraviolet, and X-ray observations (see the next image below).
“High-luminosity jets are easier to find because they create massive structures that can be seen in radio observations,” Tanner explained. “Low-luminosity jets are challenging to study observationally, so the astronomy community does not understand them as well.”
The black hole jet simulations were performed on the 127,232-core Discover supercomputer at the NCCS. Credit: NASA’s Goddard Space Flight Center Conceptual Image Lab.
Enter NASA supercomputer-enabled simulations. For realistic starting conditions, Tanner and Weaver used the total mass of a hypothetical galaxy about the size of the Milky Way. For the gas distribution and other AGN properties, they looked to spiral galaxies such as NGC 1386, NGC 3079, and NGC 4945.
Tanner modified the Athena astrophysical hydrodynamics code to explore the impacts of the jets and gas on each other across 26,000 light-years of space, about half the radius of the Milky Way. From the full set of 100 simulations, the team selected 19—which consumed 800,000 core hours on the NCCS Discover supercomputer—for publication.
“Being able to use NASA supercomputing resources allowed us to explore a much larger parameter space than if we had to use more modest resources,” Tanner said. “This led to uncovering important relationships that we could not discover with a more limited scope.”
This visualization shows the complex structure of an active galaxy’s jet (orange and purple) disrupted by interstellar molecular clouds (blue and green). With the jet oriented 30 degrees toward the galaxy’s central plane, more extensive interaction with the galaxy’s stars and gas clouds has caused the jet to split in two. Credit: Ryan Tanner and Kim Weaver, NASA Goddard.
The simulations uncovered two major properties of low-luminosity jets:
They interact with their host galaxy much more than high-luminosity jets.
They both affect and are affected by the interstellar medium within the galaxy, leading to a greater variety of shapes than high-luminosity jets.
“We have demonstrated the method by which the AGN impacts its galaxy and creates the physical features, such as shocks in the interstellar medium, that we have observed for about 30 years,” Weaver said. “These results compare well with optical and X-ray observations. I was surprised at how well theory matches observations and addresses longstanding questions I have had about AGN that I studied as a graduate student, like NGC 1386! And now we can expand to larger samples.”
More information:
Ryan Tanner et al, Simulations of AGN-driven Galactic Outflow Morphology and Content, The Astronomical Journal (2022). DOI: 10.3847/1538-3881/ac4d23
Provided by
NASA’s Goddard Space Flight Center
Citation:
NASA scientists create black hole jets with supercomputer (2022, November 29)
retrieved 30 November 2022
from https://phys.org/news/2022-11-nasa-scientists-black-hole-jets.html
This document is subject to copyright. Apart from any fair dealing for the purpose of private study or research, no
part may be reproduced without the written permission. The content is provided for information purposes only.
Nvidia Corp.’s financial results had a bit of a surprise for investors, and not on the good side — product inventories doubled to a record high as the chip company gears up for a questionable holiday season.
Nvidia reported fiscal third-quarter revenue that was slightly better than analysts’ reduced expectations Wednesday, but the numbers weren’t that great. Revenue fell 17% to $5.9 billion, while earnings were cut in half thanks to a $702 million inventory charge, largely relating to slower data-center demand in China.
Gaming revenue in the quarter fell 51% to $1.57 billion. Nvidia said it is working with its retail partners to help move the currently high-channel inventories.
While the company was writing off the inventory for China, its own new product inventory was growing. Nvidia
NVDA,
-4.54%
reported that its overall product inventory nearly doubled to $4.45 billion in the fiscal third quarter, compared with $2.23 billion a year ago and $3.89 billion in the prior quarter. Executives cited its coming product launches, designed around its new Ada and Hopper architectures, when asked about the inventory gains.
In the semiconductor industry, high inventories can make investors nervous, especially after the industry had so many supply constraints in recent years that quickly swung to a glut of chips in 2022. With doubts about demand for gaming cards and consumers’ willingness to spend amid sky-high inflation this holiday season, having all that product on hand just amps up the nerves.
Full earnings coverage: Nvidia profit chopped in half, but tweaked servers to China offset earlier $400 million warning
Chief Financial Officer Colette Kress told MarketWatch in a telephone interview Wednesday that the company’s high level of inventories were commensurate with its high levels of revenue.
“I do believe….it is our highest level of inventory,” she said. “They go hand in hand.” Kress said she was confident in the success of Nvidia’s upcoming product launches.
Nvidia’s revenue reached a peak in the April 2022 quarter with $8.3 billion, and in the past two quarters revenue has slowed, with gaming demand sluggish amid a transition to a new cycle, and a decline in China data-center demand due to COVID-19 lockdowns and U.S. government restrictions.
For its data-center customers, the new architectures promise major advances in computing power and artificial-intelligence features, with Nvidia planning to ship the equivalent of a supercomputer in a box with its new products over the next year. Those types of advanced products weigh on inventory totals even more, Kress said, because of the price of the total package.
“It’s about the complexity of the system we are building, that is what drives the inventory, the pieces of that together,” Kress said.
Bernstein Research analyst Stacy Rasgon believes that products based on Hopper will begin shipping over the next several quarters, “at materially higher price points.” He said in a recent note that he believes Nvidia’s numbers were likely hitting a bottom in this quarter.
“We remain positive on the Hopper ramp into next year, and believe numbers have at this point likely reached close to bottom, with new cycles brewing and an attractive secular story even without China potential,” Rasgon said in an earnings preview note Tuesday.
Read also: Warren Buffett’s chip-stock purchase is a classic example of why you want to be ‘greedy only when others are fearful’
Nvidia Chief Executive Jensen Huang reminded investors on a conference call that the company’s inventories are “never zero,” and said everyone is enthusiastic about the upcoming launches. But it doesn’t take too long of a memory to conjure up a time when Nvidia went into a holiday with an inventory backlog that included new architecture and greatly disappointed investors: Four years ago, Huang had to cut his forecast for holiday earnings twice amid a “crypto hangover” with similar dynamics to the current moment
Investors need faith that this holiday season will not be the same, even as demand for some videogame products declines after a pandemic boom just as the market for cryptocurrency — some of which has been mined with Nvidia products — hits a rough patch. Huang said that Nvidia’s RTX 4080 and 4090 graphics cards based on the Ada Lovelace architecture had an “exceptional launch,” and sold out.
Nvidia shares gained more than 2% in after-hours trading Wednesday, suggesting that some are betting that this time will be different. That enthusiasm needs to translate into revenue for Nvidia so that this big gain in inventories does not end up being part of another write-down at some point in the future.
Pioneering scientists from Durham University’s Institute for Computational Cosmology used the most detailed supercomputer simulations yet to reveal an alternative explanation for the Moon’s origin, 4.5 billion years ago. It revealed that a giant impact between Earth and a
The extra computational power revealed that lower-resolution simulations can miss out on crucial aspects of large-scale collisions. With high-resolution simulations, researchers can discover features that weren’t accessible in previous studies. Only the high-resolution simulations produced the Moon-like satellite, and the extra detail revealed how its outer layers contained more material originating from the Earth.
If much of the Moon formed immediately after the giant impact, then this could also mean that less became molten during formation than in the traditional theories where the Moon grew within a debris disk around Earth. Depending on the details of the subsequent solidification, these theories should predict different internal structures for the Moon.
Co-author of the study, Vincent Eke, said: “This formation route could help explain the similarity in isotopic composition between the lunar rocks returned by the Apollo astronauts and Earth’s mantle. There may also be observable consequences for the thickness of the lunar crust, which would allow us to pin down further the type of collision that took place.”
Moreover, they discovered that even when a satellite passes so close to the Earth that it might be expected to be torn apart by the “tidal forces” from Earth’s gravity, the satellite can actually survive. In fact, it can also be pushed onto a wider orbit, safe from future destruction.
A range of new possibilities
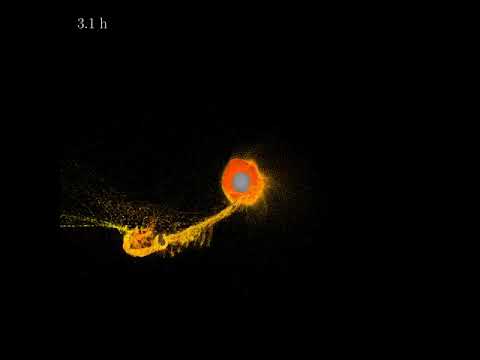
Jacob Kegerreis, lead researcher of the study, said: “This opens up a whole new range of possible starting places for the Moon’s evolution. We went into this project not knowing exactly what the outcomes of these very high-resolution simulations would be. So, on top of the big eye-opener that standard resolutions can give you wrong answers, it was extra exciting that the new results could include a tantalizingly Moon-like satellite in orbit.”
The Moon is thought to have formed after a collision between the young Earth and a Mars-sized object, called Theia, 4.5 billion years ago. Most theories construct the Moon by a gradual accumulation of the debris from this impact. However, this has been challenged by measurements of lunar rocks showing their composition is like that of Earth’s mantle, while the impact produces debris that mostly comes from Theia.
This immediate-satellite scenario opens up new possibilities for the initial lunar orbit as well as the predicted composition and internal structure of the Moon. This could help to explain unsolved mysteries like the Moon’s tilted orbit away from Earth’s equator; or could produce an early Moon that is not fully molten, which some scientists propose could be a better match for its thin crust.
The many upcoming lunar missions should reveal new clues about what kind of giant impact led to the Moon, which in turn will tell us about the history of Earth itself.
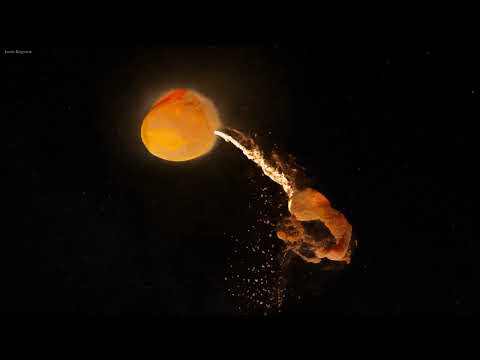
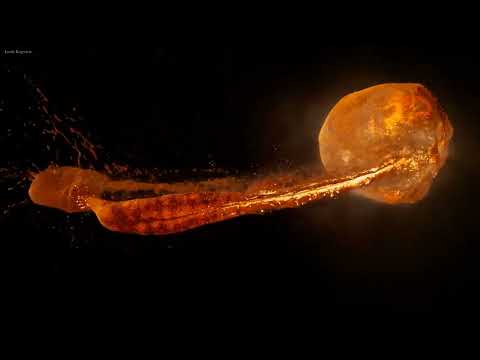
The Moon may have formed almost immediately following a devastating impact between Earth and a Mars-sized world in the ancient past, according to the results of a new supercomputer study.
Earth’s moon is a silent witness to the history of our entire species. Its gravitational influence is responsible for the tides, and its simple presence in the night sky has profoundly influenced humanity’s cultural development.
Yet despite its ever present nature, the scientific community have yet to come to a consensus on how exactly Earth’s largest natural satellite came to form.
It is widely agreed that the Moon was created when a roughly Mars-sized solar system body — which has been dubbed Theia — collided with Earth roughly 4.5 billion years ago. This impact devastated both our planet, and primordial Theia, and sent vast amounts of material from both worlds hurtling into Earth’s orbit.
Many of the previous theories surrounding the Moon’s formation suggest that it slowly coalesced from this soup of orbital debris, until finally the remainder of the material not accumulated by the satellite fell back in towards Earth.
In this scenario, the orbital debris would have been largely comprised of the remains of Theia. However, rock samples recovered from the Moon’s surface by Apollo-era astronauts showed a surprising structural and isotopic similarity to those found on Earth.
Whilst it is possible, the authors of a new study found it unlikely that the material from Theia would have such a close match with that of the Earth.
In the new study, a team of researchers from Durham University in the UK used the powerful DiRAC supercomputing facility to run a range of simulations that could account for the creation of Earth’s moon.
Moonbreaker – Gamescom 2022
The supercomputer used a significantly larger number of particles to simulate the ancient collision compared to previous studies. According to the team, lower resolution simulations can omit important aspects of the collision process.
Over the course of the study, the scientists ran hundreds of these high-resolution simulations while varying a range of key parameters, including the masses, spins, angles, and speeds of the two unfortunate worlds.
The simulations revealed that a large body with a Moon-like mass and iron content could have coalesced almost immediately in orbit following the Earth-Theia collision. The detailed simulation showed that the newly born hypothetical satellite would have been created beyond the Roche limit – which is the orbital distance at which a satellite can orbit a planet without being shredded by its gravity.
Furthermore, the outer layers of such a world would be rich in material ejected from Earth, thus explaining the similarities between the Apollo-era rocks and those from our planet.
NASA’s Super Heavy Moon Rocket – The Space Launch System
“This formation route could help explain the similarity in isotopic composition between the lunar rocks returned by the Apollo astronauts and Earth’s mantlle,” explains study co-author Vincent Eke, an Associate Professor in the Department of Physics at the University of Exeter. “There may also be observable consequences for the thickness of the lunar crust, which would allow us to pin down further the type of collision that took place.”
If the Moon did form quickly following the impact, then its internal structure would likely be different than if it had grown gradually from a circumplanetary disk of debris. Astronauts returning to the Moon in the coming decades under NASA’s Artemis Program will collect fresh samples from the lunar surface that can be used to test the quick formation theory.
The research could help update scientist’s understanding as to how moons form in the orbits of distant worlds spread throughout the universe.
Anthony Wood is a freelance science writer for IGN
An image of the supernova remnant as an orange cloud. (Image credit: Author provided)
This article was originally published at The Conversation. (opens in new tab) The publication contributed the article to Space.com’s Expert Voices: Op-Ed & Insights.
Within 24 hours of accessing the first stage of Australia’s newest supercomputing system, researchers have processed a series of radio telescope observations, including a highly detailed image of a supernova remnant.
The very high data rates and the enormous data volumes from new-generation radio telescopes such as ASKAP (opens in new tab) (Australian Square Kilometre Array Pathfinder) need highly capable software running on supercomputers. This is where the Pawsey Supercomputing Research Centre comes into play, with a newly launched supercomputer called Setonix (opens in new tab) – named after Western Australia’s favourite animal, the quokka (opens in new tab) (Setonix brachyurus).
ASKAP, which consists of 36 dish antennas that work together as one telescope, is operated by Australia’s national science agency CSIRO; the observational data it gathers are transferred via high-speed optical fibres to the Pawsey Centre for processing and converting into science-ready images.
In a major milestone on the path to full deployment, we have now demonstrated the integration of our processing software ASKAPsoft on Setonix, complete with stunning visuals.
Related: Why dead stars go boom: The mechanism behind supernova explosions
Traces of a dying star
An exciting outcome of this exercise has been a fantastic image of a cosmic object known as a supernova remnant, G261.9+5.5 (opens in new tab).
Estimated to be more than a million years old, and located 10,000-15,000 light-years away from us, this object in our galaxy was first classified (opens in new tab) as a supernova remnant by CSIRO radio astronomer Eric R. Hill in 1967, using observations from CSIRO’s Parkes Radio Telescope, Murriyang (opens in new tab).
Supernova remnants (SNRs) are the remains of powerful explosions from dying stars. The ejected material from the explosion ploughs outwards into the surrounding interstellar medium at supersonic speeds, sweeping up gas and any material it encounters along the way, compressing and heating them up in the process.
Additionally, the shockwave would also compress the interstellar magnetic fields. The emissions we see in our radio image of G261.9+5.5 are from highly energetic electrons trapped in these compressed fields. They bear information about the history of the exploded star and aspects of the surrounding interstellar medium.
The structure of this remnant revealed in the deep ASKAP radio image opens up the possibility of studying this remnant and the physical properties (such as magnetic fields and high-energy electron densities) of the interstellar medium in unprecedented detail.
The new supercomputer is named after the iconic quokka. (Image credit: Chia Chuin Wong/Shutterstock)
Putting a supercomputer through its paces
The image of SNR G261.9+05.5 might be beautiful to look at, but the processing of data from ASKAP’s astronomy surveys is also a great way to stress-test the supercomputer system, including the hardware and the processing software.
We included the supernova remnant’s dataset for our initial tests because its complex features would increase the processing challenges.
Data processing even with a supercomputer is a complex exercise, with different processing modes triggering various potential issues. For example, the image of the SNR was made by combining data gathered at hundreds of different frequencies (or colours, if you like), allowing us to get a composite view of the object.
But there is a treasure trove of information hidden in the individual frequencies as well. Extracting that information often requires making images at each frequency, requiring more computing resources and more digital space to store.
While Setonix has adequate resources for such intense processing, a key challenge would be to establish the stability of the supercomputer when lashed with such enormous amounts of data day in and day out.
Key to this quick first demonstration was the close collaboration between the Pawsey Centre and the ASKAP science data processing team members. Our teamwork enabled all of us to better understand these challenges and quickly find solutions.
These results mean we will be able to unearth more from the ASKAP data, for example.
More to come
But this is only the first of two installation stages for Setonix, with the second expected to be completed later this year.
This will allow data teams to process more of the vast amounts of data coming in from many projects in a fraction of the time. In turn, it will not only enable researchers to better understand our Universe but will undoubtedly uncover new objects hidden in the radio sky. The variety of scientific questions that Setonix will allow us to explore in shorter time-frames opens up so many possibilities.
This increase in computational capacity benefits not just ASKAP, but all Australia-based researchers in all fields of science and engineering that can access Setonix.
While the supercomputer is ramping up to full operations, so is ASKAP, which is currently wrapping up a series of pilot surveys and will soon undertake even larger and deeper surveys of the sky.
The supernova remnant is just one of many features we’ve now revealed, and we can expect many more stunning images, and the discovery of many new celestial objects, to come soon.
This article is republished from The Convers (opens in new tab)ation under a Creative Commons license. Read the original article (opens in new tab).
Follow all of the Expert Voices issues and debates. The views expressed are those of the author and do not necessarily reflect the views of the publisher.
Within 24 hours of accessing the first stage of Australia’s newest supercomputing system, researchers have processed a series of radio telescope observations, including a highly detailed image of a supernova remnant.
The very high data rates and the enormous data volumes from new-generation radio telescopes such as ASKAP (Australian Square Kilometre Array Pathfinder) need highly capable software running on supercomputers.
This is where the Pawsey Supercomputing Research Centre comes into play, with a newly launched supercomputer called Setonix – named after Western Australia’s favorite animal, the quokka (Setonix brachyurus).
ASKAP, which consists of 36 dish antennas that work together as one telescope, is operated by Australia’s national science agency CSIRO; the observational data it gathers are transferred via high-speed optical fibers to the Pawsey Centre for processing and converting into science-ready images.
In a major milestone on the path to full deployment, we have now demonstrated the integration of our processing software ASKAPsoft on Setonix, complete with stunning visuals.
Traces of a dying star
An exciting outcome of this exercise has been a fantastic image of a cosmic object known as a supernova remnant, G261.9+5.5.
Estimated to be more than a million years old, and located 10,000-15,000 light-years away from us, this object in our galaxy was first classified as a supernova remnant by CSIRO radio astronomer Eric R. Hill in 1967, using observations from CSIRO’s Parkes Radio Telescope, Murriyang.
Supernova remnants (SNRs) are the remains of powerful explosions from dying stars. The ejected material from the explosion plows outwards into the surrounding interstellar medium at supersonic speeds, sweeping up gas and any material it encounters along the way, compressing and heating them up in the process.
The galactic supernova remnant G261.9+5.5. (Wasim Raja/CSIRO; Pascal Elah/Pawsey)
Additionally, the shockwave would also compress the interstellar magnetic fields. The emissions we see in our radio image of G261.9+5.5 are from highly energetic electrons trapped in these compressed fields. They bear information about the history of the exploded star and aspects of the surrounding interstellar medium.
The structure of this remnant revealed in the deep ASKAP radio image opens up the possibility of studying this remnant and the physical properties (such as magnetic fields and high-energy electron densities) of the interstellar medium in unprecedented detail.
Putting a supercomputer through its paces
The image of SNR G261.9+05.5 might be beautiful to look at, but the processing of data from ASKAP’s astronomy surveys is also a great way to stress-test the supercomputer system, including the hardware and the processing software.
We included the supernova remnant’s dataset for our initial tests because its complex features would increase the processing challenges.
Data processing even with a supercomputer is a complex exercise, with different processing modes triggering various potential issues. For example, the image of the SNR was made by combining data gathered at hundreds of different frequencies (or colors, if you like), allowing us to get a composite view of the object.
But there is a treasure trove of information hidden in the individual frequencies as well. Extracting that information often requires making images at each frequency, requiring more computing resources and more digital space to store.
While Setonix has adequate resources for such intense processing, a key challenge would be to establish the stability of the supercomputer when lashed with such enormous amounts of data day in and day out.
Key to this quick first demonstration was the close collaboration between the Pawsey Centre and the ASKAP science data processing team members. Our teamwork enabled all of us to better understand these challenges and quickly find solutions.
These results mean we will be able to unearth more from the ASKAP data, for example.
More to come
But this is only the first of two installation stages for Setonix, with the second expected to be completed later this year.
This will allow data teams to process more of the vast amounts of data coming in from many projects in a fraction of the time. In turn, it will not only enable researchers to better understand our Universe but will undoubtedly uncover new objects hidden in the radio sky. The variety of scientific questions that Setonix will allow us to explore in shorter time frames opens up so many possibilities.
This increase in computational capacity benefits not just ASKAP, but all Australia-based researchers in all fields of science and engineering that can access Setonix.
While the supercomputer is ramping up to full operations, so is ASKAP, which is currently wrapping up a series of pilot surveys and will soon undertake even larger and deeper surveys of the sky.
The supernova remnant is just one of many features we’ve now revealed, and we can expect many more stunning images, and the discovery of many new celestial objects, to come soon.
Wasim Raja, Research scientist, CSIRO and Pascal Jahan Elahi, Supercomputing applications specialist, Pawsey Supercomputing Research Centre, CSIRO.
This article is republished from The Conversation under a Creative Commons license. Read the original article.
Summary: Researchers present an all-atom molecular dynamic simulation of synaptic vesicle fusion.
Source: Texas Advanced Computing Center
Let’s think for a second about thought—specifically, the physics of neurons in the brain.
This topic has been the lifelong interest of Jose Rizo-Rey, professor of Biophysics at the University of Texas Southwestern Medical Center.
Our brains have billions of nerve cells or neurons, and each neuron has thousands of connections to other neurons. The calibrated interactions of these neurons is what thoughts are made of, whether the explicit kind—a distant memory surfacing—or the taken-for-granted kind—our peripheral awareness of our surroundings as we move through the world.
“The brain is an amazing network of communications,” said Rizo-Rey. “When a cell gets excited by electrical signals, very fast synaptic vesicle fusion occurs. The neurotransmitters come out of the cell and bind to receptors on the synaptic side. That’s the signal and this process is very fast.”
How exactly these signals can occur so fast—less than 60 microseconds or millionths of a second—is the focus of intense study. So is the dysregulation of this process in neurons, which causes a host of neurological conditions, from Alzheimer’s to Parkinson’s disease.
Decades of research has led to a thorough understanding of the main protein players and the broad strokes of membrane fusion for synaptic transmission. Bernard Katz was awarded the 1970 Nobel Prize in Medicine in part for demonstrating that chemical synaptic transmission consists of a neurotransmitter-filled synaptic vesicle fusing with the plasma membrane at nerve endings and releasing its content into the opposing postsynaptic cell.
And Rizo-Rey’s longtime collaborator, Thomas Südhof, won the Nobel Prize in Medicine in 2013 for his studies of the machinery that mediates neurotransmitter release (many with Rizo-Rey as a co-author).
But Rizo-Rey says his goal is to understand the specific physics of how the activation process of thought occurs in much more detail. “If I can understand that, winning the Nobel Prize would just be a small reward,” he said.
Recently, using the Frontera supercomputer at the Texas Advanced Computing Center (TACC), one of the most powerful systems in the world, Rizo-Rey has been exploring this process, creating a multi-million atom model of the proteins, the membranes, and their environment, and setting them in motion virtually to see what happens, a process known as molecular dynamics.
Writing in eLife in June 2022, Rizo-Rey and collaborators presented all-atom molecular dynamics simulations of synaptic vesicle fusion, providing a glimpse at the primed state. The research shows a system where several specialized proteins are “spring-loaded,” awaiting only the delivery of calcium ions to trigger fusion.
“It’s ready to release, but it doesn’t,” he explained. “Why doesn’t it? It’s waiting for the calcium signal. Neurotransmission is about controlling fusion. You want to have the system ready to fuse, so when calcium comes in, it can happen very fast, but it’s not fusing yet.”
Initial configuration of the molecular dynamics simulations designed to investigate the nature of the primed state of synaptic vesicles. Credit: Jose Rizo-Rey, UT Southwestern Medical Center
The study represents a return to computational approaches for Rizo-Rey, who recalls using the original Cray supercomputer at the University of Texas at Austin in the early 1990s. He went on to use primarily experimental methods like nuclear magnetic resonance spectroscopy over the past three decades to study the biophysics of the brain.
“Supercomputers weren’t powerful enough to resolve this problem of how transmission was occurring in the brain. So for a long time, I used other methods,” he said. “However, with Frontera, I can model 6 million atoms and really get a picture of what’s going on with this system.”
Rizo-Rey’s simulations only cover the first few microseconds of the fusion process, but his hypothesis is that the act of fusion should happen in that time. “If I see how it’s starting, the lipids starting to mix, then I’ll ask for 5 million hours [the maximum time available] on Frontera,” he said, to capture the snap of the spring-loaded proteins and the step-by-step process by which the fusion and transmission happens.
Rizo-Rey says the sheer amount of computation that can be harnessed today is unbelievable. “We have a supercomputer system here at the University of Texas Southwestern Medical Center. I can use up to 16 nodes,” he said. “What I did on Frontera, instead of a few months, would have taken 10 years.”
Investing in basic research—and in the computing systems that support this type of research—is fundamental to the health and well-being of our nation, Rizo-Rey says.
“This country was very successful because of basic research. Translation is important, but if you don’t have the basic science, you have nothing to translate.”
See also
About this computational neuroscience research news
Author: Aaron Dubrow Source: Texas Advanced Computing Center Contact: Aaron Dubrow – Texas Advanced Computing Center Image: The image is credited to Jose Rizo-Rey, UT Southwestern Medical Center
Original Research: Open access. “All-atom molecular dynamics simulations of Synaptotagmin-SNARE-complexin complexes bridging a vesicle and a flat lipid bilayer” by Josep Rizo et al. eLife
Abstract
All-atom molecular dynamics simulations of Synaptotagmin-SNARE-complexin complexes bridging a vesicle and a flat lipid bilayer
Synaptic vesicles are primed into a state that is ready for fast neurotransmitter release upon Ca2+-binding to Synaptotagmin-1. This state likely includes trans-SNARE complexes between the vesicle and plasma membranes that are bound to Synaptotagmin-1 and complexins.
However, the nature of this state and the steps leading to membrane fusion are unclear, in part because of the difficulty of studying this dynamic process experimentally.
To shed light into these questions, we performed all-atom molecular dynamics simulations of systems containing trans-SNARE complexes between two flat bilayers or a vesicle and a flat bilayer with or without fragments of Synaptotagmin-1 and/or complexin-1.
Our results need to be interpreted with caution because of the limited simulation times and the absence of key components, but suggest mechanistic features that may control release and help visualize potential states of the primed Synaptotagmin-1-SNARE-complexin-1 complex.
The simulations suggest that SNAREs alone induce formation of extended membrane-membrane contact interfaces that may fuse slowly, and that the primed state contains macromolecular assemblies of trans-SNARE complexes bound to the Synaptotagmin-1 C2B domain and complexin-1 in a spring-loaded configuration that prevents premature membrane merger and formation of extended interfaces, but keeps the system ready for fast fusion upon Ca2+ influx.
Cupermassive black hole with an X-ray jet. Credit: NASA/CXC/M.Weiss
Further confirmation of Einstein’s theory of general relativity.
The galaxy Messier 87 (M87) is located 55 million light years away from Earth in the Virgo constellation. It is a giant galaxy with 12,000 globular clusters, making the
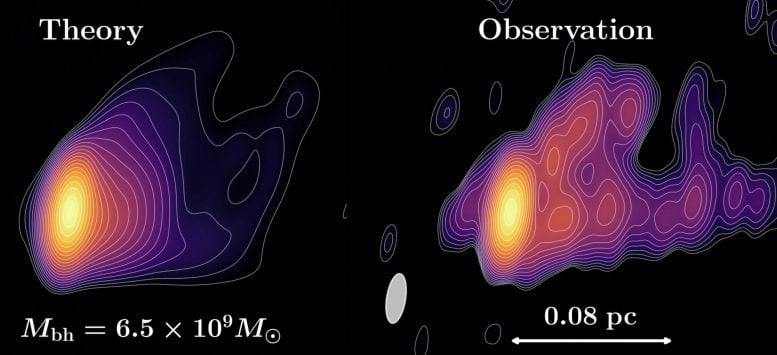
The theoretical model (theory) and the astronomical observations (observation) of the launching site of the relativistic jet of M87 are a very good match. Credit: Alejandro Cruz-Osorio
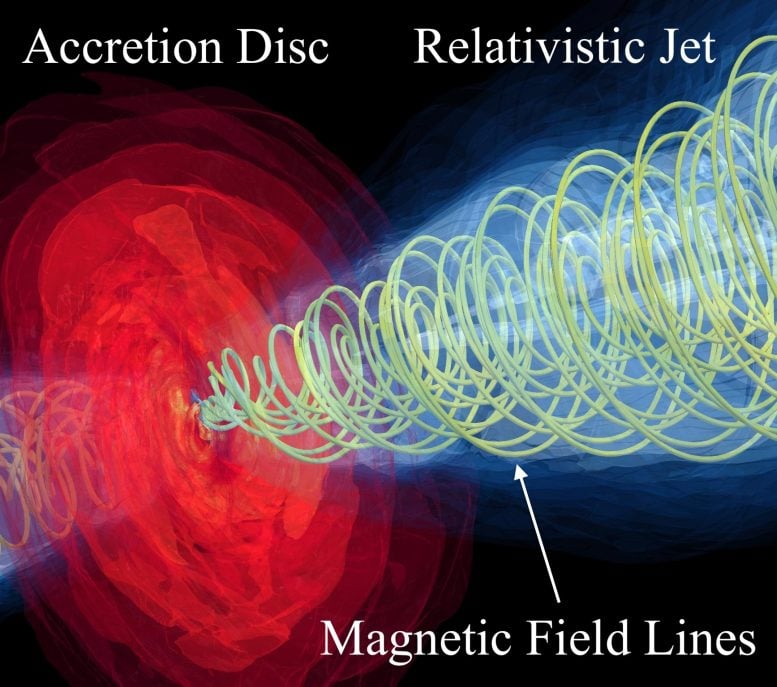
The black hole M87* attracts matter that rotates in a disc in ever smaller orbits until it is swallowed by the black hole. The jet is launched from the center of the accretion disc surrounding M87, and theoretical physicists at Goethe University, together with scientists from Europe, USA, and China, have now modeled this region in great detail.
They used highly sophisticated three-dimensional supercomputer simulations that use the staggering amount of a million CPU hours per simulation and had to simultaneously solve the equations of general relativity by Albert Einstein, the equations of electromagnetism by James Maxwell, and the equations of fluid dynamics by Leonhard Euler.
Along the magnetic field lines, the particles are accelerated so efficiently that they form a jet out to scales of 6000 light years in the case of M87. Credit: Alejandro Cruz-Osorio
The result was a model in which the values calculated for the temperatures, the matter densities and the magnetic fields correspond remarkably well with what deduced from the astronomical observations. On this basis, scientists were able to track the complex motion of photons in the curved spacetime of the innermost region of the jet and translate this into radio images. They were then able to compare these computer-modeled images with the observations made using numerous radio telescopes and satellites over the past three decades.
Dr. Alejandro Cruz-Osorio, lead author of the study, comments: “Our theoretical model of the electromagnetic emission and of the jet morphology of M87 matches surprisingly well with the observations in the radio, optical and infrared spectra. This tells us that the supermassive black hole M87* is probably highly rotating and that the plasma is strongly magnetized in the jet, accelerating particles out to scales of thousands of light years.”
Professor Luciano Rezzolla, Institute for Theoretical Physics at Goethe University Frankfurt, remarks: “The fact that the images we calculated are so close to the astronomical observations is another important confirmation that Einstein’s theory of general relativity is the most precise and natural explanation for the existence of supermassive black holes in the center of galaxies. While there is still room for alternative explanations, the findings of our study have made this room much smaller.”
Reference: “State-of-the-art energetic and morphological modelling of the launching site of the M87 jet” by Alejandro Cruz-Osorio, Christian M. Fromm, Yosuke Mizuno, Antonios Nathanail, Ziri Younsi, Oliver Porth, Jordy Davelaar, Heino Falcke, Michael Kramer and Luciano Rezzolla, 4 November 2021, Nature Astronomy. DOI: 10.1038/s41550-021-01506-w
ApJ, 917, 53″ width=”665″ height=”530″/>
Distribution of gas across scales, with the gas density increasing from purple to yellow. The top left panel shows a large region containing tens of galaxies (6 million light-years across). Subsequent panels zoom in progressively into the nuclear region of the most massive galaxy and down to the vicinity of the central supermassive black hole. Gas clumps and filaments fall from the inner edge of the central cavity occasionally feeding the black hole. Credit: Anglés-Alcázar et al. 2021, ApJ, 917, 53
At the center of galaxies, like our own Milky Way, lie massive black holes surrounded by spinning gas. Some shine brightly, with a continuous supply of fuel, while others go dormant for millions of years, only to reawaken with a serendipitous influx of gas. It remains largely a mystery how gas flows across the universe to feed these massive black holes.
UConn Assistant Professor of Physics Daniel Anglés-Alcázar, lead author on a paper published today in The Astrophysical Journal, addresses some of the questions surrounding these massive and enigmatic features of the universe by using new, high-powered simulations.
“Supermassive black holes play a key role in galaxy evolution and we are trying to understand how they grow at the centers of galaxies,” says Anglés-Alcázar. “This is very important not just because black holes are very interesting objects on their own, as sources of gravitational waves and all sorts of interesting stuff, but also because we need to understand what the central black holes are doing if we want to understand how galaxies evolve.”
Anglés-Alcázar, who is also an Associate Research Scientist at the Flatiron Institute Center for Computational Astrophysics, says a challenge in answering these questions has been creating models powerful enough to account for the numerous forces and factors that play into the process. Previous works have looked either at very large scales or the very smallest of scales, “but it has been a challenge to study the full range of scales connected simultaneously.”
Galaxy formation, Anglés-Alcázar says, starts with a halo of dark matter that dominates the mass and gravitational potential in the area and begins pulling in gas from its surroundings. Stars form from the dense gas, but some of it must reach the center of the galaxy to feed the black hole. How does all that gas get there? For some black holes, this involves huge quantities of gas, the equivalent of ten times the mass of the sun or more swallowed in just one year, says Anglés-Alcázar.
“When supermassive black holes are growing very fast, we refer to them as quasars,” he says. “They can have a mass well into one billion times the mass of the sun and can outshine everything else in the galaxy. How quasars look depends on how much gas they add per unit of time. How do we manage to get so much gas down to the center of the galaxy and close enough that the black hole can grab it and grow from there?”
The new simulations provide key insights into the nature of quasars, showing that strong gravitational forces from stars can twist and destabilize the gas across scales, and drive sufficient gas influx to power a luminous quasar at the epoch of peak galaxy activity.
In visualizing this series of events, it is easy to see the complexities of modeling them, and Anglés-Alcázar says it is necessary to account for the myriad components influencing black hole evolution.
“Our simulations incorporate many of the key physical processes, for example, the hydrodynamics of gas and how it evolves under the influence of pressure forces, gravity, and feedback from massive stars. Powerful events such as supernovae inject a lot of energy into the surrounding medium and this influences how the galaxy evolves, so we need to incorporate all of these details and physical processes to capture an accurate picture.”
Building on previous work from the FIRE (“Feedback In Realistic Environments”) project, Anglés-Alcázar explains the new technique outlined in the paper that greatly increases model resolution and allows for following the gas as it flows across the galaxy with more than a thousand times better resolution than previously possible,
“Other models can tell you a lot of details about what’s happening very close to the black hole, but they don’t contain information about what the rest of the galaxy is doing, or even less, what the environment around the galaxy is doing. It turns out, it is very important to connect all of these processes at the same time, this is where this new study comes in.”
The computing power is similarly massive, Anglés-Alcázar says, with hundreds of central processing units (CPUs) running in parallel that could have easily taken the length of millions of CPU hours.
“This is the first time that we have been able to create a simulation that can capture the full range of scales in a single model and where we can watch how gas is flowing from very large scales all the way down to the very center of the massive galaxy that we are focusing on.”
For future studies of large statistical populations of galaxies and massive black holes, we need to understand the full picture and the dominant physical mechanisms for as many different conditions as possible, says Anglés-Alcázar.
“That is something we are definitely excited about. This is just the beginning of exploring all of these different processes that explain how black holes can form and grow under different regimes.”
Astronomers discover how to feed a black hole
More information:
Daniel Anglés-Alcázar et al, Cosmological Simulations of Quasar Fueling to Subparsec Scales Using Lagrangian Hyper-refinement, The Astrophysical Journal (2021). DOI: 10.3847/1538-4357/ac09e8
Provided by
University of Connecticut
Citation:
Cracking a mystery of massive black holes and quasars with supercomputer simulations (2021, August 17)
retrieved 17 August 2021
from https://phys.org/news/2021-08-mystery-massive-black-holes-quasars.html
This document is subject to copyright. Apart from any fair dealing for the purpose of private study or research, no
part may be reproduced without the written permission. The content is provided for information purposes only.