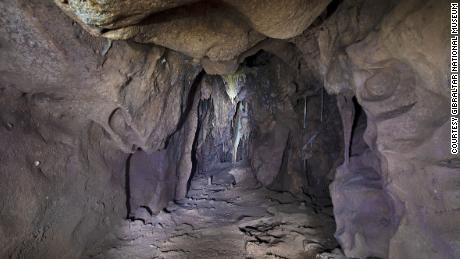
The entrance to Denisova Cave in Sibera. Image: IAET, Siberian Branch Russian Academy of Sciences
The Denisovans, a mysterious group of extinct hominins closely related to Neanderthals, didn’t leave much fossil evidence behind. A fresh dig at their former stomping grounds in Siberia has now yielded three new fossils—the oldest yet found of this species.
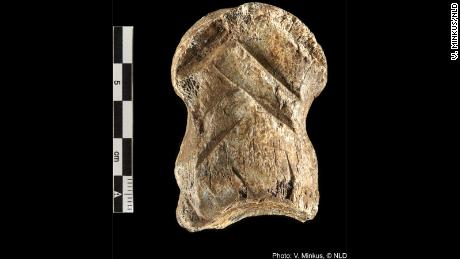
Katerina Douka, an evolutionary anthropologist from the University of Vienna, and her colleagues found the fossils in Denisova Cave, a natural shelter located in the Altai Mountains of southern Siberia. The scientists were studying the oldest layers in the cave, which up until now had failed to produce a single human fossil. A total of five human fossil fragments were recovered: three belonging to Denisovans, one from a Neanderthal, and one that could not be identified. The largest of these fragments measures no larger than 1.6 inches (4 centimeters) long.
Remarkably, this small but precious handful of fossils were found amid a jumble of 3,791 animal bone fragments. The researchers used a biomolecular method known as peptide fingerprinting to identify the bones, as it was not possible to do so through manual inspection. The five bones contained collagen consistent with the peptide profiles of humans (peptides are the building blocks of proteins), allowing for the identification (as a reminder, Denisovans and Neanderthals are humans).
Some of the bone fragments recovered in Denisova Cave. Image: S. Brown
“Finding one new human bone would have been cool, but five? This exceeded my wildest dreams,” Samantha Brown, a co-author of the study and junior group leader at the University of Tübingen, said in a Max Planck Institute statement.
G/O Media may get a commission
Denisova Cave is an “amazing place” when it comes to the preservation of DNA, and “we have now reconstructed genomes from some of the oldest and best-preserved human fossils,” said Diyendo Massilani, a geneticist from the Max Planck Institute of Evolutionary Anthropology, in the release. The team found enough DNA to reconstruct mitochondrial genomes, allowing them to confirm the bones as belonging to Denisovans and Neanderthals. A paper detailing this discovery has been published in Nature Ecology & Evolution.
The layer containing the Denisovan bones was dated to roughly 200,000 years old. Previous Denisovan fossils were dated to between 122,000 and 194,000 years old, so these are now the oldest. The lone Neanderthal bone was dated to between 130,000 and 150,000 years ago. The Altai mountains appear to “be an overlapping zone for both Denisovan and Neanderthal groups for over 150,000 years, witnessing and possibly facilitating population [interbreeding] as well as sustaining distinct hominin populations over this long period,” according to the paper.
The three new Denisovan fossils add to the six already discovered, including a finger bone from which DNA was extracted and a mandible found in a cave on the Tibetan Plateau—the first and only Denisovan fossil found outside of Siberia. Denisovans were closely related to Neanderthals, and they interbred with modern humans prior to going extinct some 50,000 to 30,000 years ago. Traces of Denisovan DNA exist within the genomes of modern southeast Asian and Oceanian populations.
As the scientists write in their study, “a wealth of archaeological material” in the form of stone tools and animal remains were found within the Denisovan layer. It’s the first time that archaeological evidence has been definitively linked to these hominins, allowing for new insights into their behavior.
Interestingly, the style of the recovered stone tools, like scraping tools for working animal hides, could not be matched to any known lithic tradition. Living near the Anui river and occupying the caves during a warm period, the Denisovans hunted bison, deer, gazelle, antelope, and woolly rhinos, in a subsistence pattern that lasted for thousands of years, as the researchers point out.
These three Denisovan bones will likely produce more science in the years to come, as will Denisova Cave in general. Slowly but very methodically, we’re uncovering more about these remarkable humans.
More: Scientists Have Discovered a Hotspot of Denisovan Ancestors.
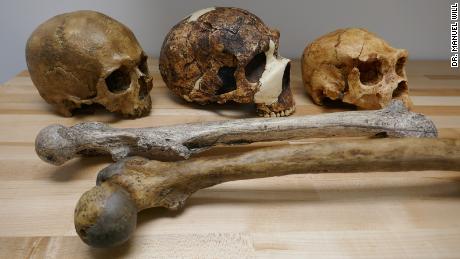
Researchers were reexamining the fossilized bones of a Neanderthal who was found in a cave near the French village of La Chapelle-aux-Saints in 1908. The “Old Man of La Chapelle,” as he became known, was the first relatively complete Neanderthal skeleton to be unearthed and is one of the best studied.
More than a century after his discovery, his bones are still yielding new information about the lives of Neanderthals, the heavily built Stone Age hominins thatlived in Europe and parts of Asia before disappearing about 40,000 years ago.
The man, thought to be in hislate 50s or 60s when he died about 50,000 years ago, had advanced osteoarthritis in his spinal column and hip joint, a study from 2019 had confirmed.
However, during that reanalysis, Dr. Martin Haeusler — a specialist in internal medicine and head of the University of Zurich’s Evolutionary Morphology and Adaptation Group at the Institute of Evolutionary Medicine — realized that not all the changes in the bones could be explained by the wear and tear of osteoarthritis.
“Rather, we found that some of these pathological changes must be due to inflammatory processes,” he said.
“A comparison of the entire pattern of the pathological changes found in the La Chapelle-aux-Saints skeleton with many different diseases led us then to the diagnosis of brucellosis.”
The study with those findings was published in the journal Scientific Reports last month.
Zoonotic disease
Brucellosis is a disease that’s still widespread today. Humans generally acquire the disease through direct contact with infected animals, by eating or drinking contaminated animal products, or by inhaling airborne agents, according to the World Health Organization. Most cases are caused by unpasteurized milk or cheese from infected goats or sheep.
It’s also one of the most common zoonotic diseases — illnesses that are transmitted from animals to humans. They include viruses like HIV and the coronavirus that caused the Covid-19 pandemic.
Brucella has a wide range of symptoms, including fever, muscular pain and night sweats, Haeusler said. It can last from a few weeks to many months or even years. Long-term problems resulting from the disease are variable but can include arthritis pain, back pain, inflammation of the testes — which can lead to infertility — and inflammation of the heart valves known as endocarditis, which Haeusler said was the most common cause of death from the disease.
The paper said the case was “the earliest secure evidence of this zoonotic disease in hominin evolution.”
The disease has also been found in Bronze Age Homo sapiens skeletons, which date back to around 5,000 years ago.
Diet
Brucellosis is found in many wild animals today, and Haeusler said that the Neanderthal man likely caught the disease from butchering or cooking an animal that had been hunted as prey.Possible sources include wild sheep, goats, wild cattle, bison, reindeer, hares and marmots — all of which were components of the Neanderthal diet. However, the paper said that the two large animals Neanderthals hunted, mammoths and woolly rhinoceros, were unlikely to be the disease reservoir — at least based on the animals’ living relatives, in which brucellosis has been largely undetected.
Given the man lived to what must have been a very old age for the period, Haeusler suspected that the Neanderthalmay have had a milder version of the disease.
The “Old Man of Chapelle” played a significant role in misconceptions about Neanderthals being primitive Stone Age brutes, according to the Smithsonian. More recent research suggests that they were just as smart as we are.
An early reconstruction of the skeleton depicted the man with a slouching posture, bent knees and the head jutted forward. It was only later that scientists realized the skeleton had a deforming kind of osteoarthritis and perhaps was not a typical Neanderthal.
Haeusler said the study he published in 2019 showed that, even with the wear and tear from degenerative osteoarthritis, the “Old Man of Chapelle” would have walked upright. The man also had lost most of his teeth and may have had to have been fed by other members of his group.
By now you might have heard the factoid that modern humans share a pretty large chunk of our genomes with bananas. But delving down much deeper, how much of our genome is uniquely Homo sapiens.
A new study has suggested that number could be as small as 1.5 percent, with the rest being shared with our ancient relatives such as Neanderthals and Denisovans.
“We generate a map within human genomes of archaic ancestry and of genomic regions not shared with archaic hominins,” the team wrote in their new paper.
“We find that only 1.5 to 7 percent of the modern human genome is uniquely human.”
Untangling what is ours and what came from our ancient kin is a difficult task. How do you tell which genetic variants are due to interbreeding (also called admixing) of Neanderthals and Homo sapiens for example, rather than variants that were passed onto both species from a common ancestor?
The team wanted to create a system that could identify both admixture events as well as this shared inheritance – called incomplete lineage sorting – that would help tell us which regions of our genome are unique to us.
They created an algorithm called SARGE – Speedy Ancestral Recombination Graph Estimator – so they could map how our genes have weaved through time and species, separating and joining back together at different points using something called ancestral recombination graphs.
They ran SARGE on 279 modern human genomes from Africa and elsewhere, two high-quality Neanderthal genomes, and one high-quality Denisovan genome.
“Using the resulting ancestral recombination graph, we map Neanderthal and Denisovan ancestry, incomplete lineage sorting, and the absence of both across modern human genomes,” the team wrote.
“We find evidence of at least one wave of Neanderthal admixture into the ancestors of all non-Africans.”
Along with the 1.5 to 7 percent of the genome that’s unique to modern humans, they also found “evidence of multiple bursts of adaptive changes specific to modern humans within the past 600,000 years involving genes related to brain development and function”.
The researchers explain that most of those genes that were uniquely ours were not genes with unknown functions, instead they were well known genes which coded for proteins used in the brain.
Obviously, this is not even close to the end of the story. For starters, between 1.5 and 7 percent is a pretty large range and the team think they can make it more specific with more genomes and more research.
There have also been plenty of other analyses looking at the percentage of DNA we take from our ancient cousins, so it’s unlikely this will be the last word on the matter.
Plus, SARGE isn’t able to tell the researchers why those bursts of adaptive changes happened when they did.
However, the team already has some ideas.
“It’s extremely tempting to speculate that one or more of these bursts had something to do the incredibly social behavior humans have – mediated in large part by our expert control of speech and language,” University of California, Santa Cruz paleogeneticist and one of the researchers, Richard Green, told Business Insider.
The research has been published in Science Advances.
Much of the current genetic variation within humans predates the split, estimated at 520 to 630 thousand years (ka) ago (1), between the populations that would become modern humans and Neanderthals. The shared genetic variation present in our common ancestral population is still largely present among humans today and was present in Neanderthals up until the time of their extinction. This phenomenon, which is known as incomplete lineage sorting (ILS), means that any particular human will share many alleles with a Neanderthal that are not shared with some other humans. Therefore, humans often share genetic variation with Neanderthals not by admixture but rather by shared inheritance from a population ancestral to us both. Because of this, any effort to map ancestry from archaic hominins in human genomes must disentangle admixture from ILS. Furthermore, a technique able to identify both admixture and ILS could produce a catalog of uniquely human genomic regions that is free of both and thereby shed light on the evolutionary processes that have been important in our origin as a unique species.
Ancestral recombination graph (ARG) inference (2) is a powerful starting point for such an analysis. An ARG can be conceptualized as a series of trees, mapped to individual sites, over phased haplotypes (chromosomes) in a panel of genomes. Ancestral recombination events, or sites at which chromosome segments with different histories were joined together by historical recombination, form boundaries between trees. Each ancestral recombination event manifests as a clade of haplotypes, all of which descend from the first ancestral haplotype to have it, moving from one position in the tree upstream of the event to a new position in the downstream tree (3). ARGs are complete descriptions of phylogenomic datasets and present for recombining genomes what single trees present for nonrecombining genomes, i.e., a complete description of their genetic relationships. As prior techniques for ancestry mapping can be thought of as summaries of the ARG, higher resolution ancestry maps could be produced if the ARG were known. In addition, the ARG can be used to estimate the time to most recent common ancestor (TMRCA) between admixed and admixer haplotypes, providing additional information about historical admixture between humans and archaic hominins.
Given the utility of an ARG, it is expected that several methods have been devised for estimating ARGs from genetic data. These published approaches all have different strengths and limitations. BEAGLE (3), ArgWeaver (4), and Rent+ (5) were designed for small datasets and require substantial time and/or memory to be used with large sequencing panels. Margarita (6) randomly samples histories at ancestral recombination event boundaries and does not seek to produce parsimonious recombination histories (6). ArgWeaver (4), which is widely considered the gold standard in ARG inference, requires prior knowledge of demographic model parameters. Relate (7) is a relatively new method that scales well to large datasets and produces trees without polytomies and with branch lengths but, in doing so, necessarily samples some relationships that are not directly inferred from the data, as do several other methods (4, 5). The most computationally efficient approach, tsinfer (8), also scales to large datasets but assumes that frequency of an allele is correlated with its age. Since this assumption is violated at loci undergoing either admixture or selection, tsinfer is not well suited for ARG inference using genetic data from Neanderthals, Denisovans, and modern humans.
Here, we present a heuristic, parsimony-guided ARG inference algorithm called SARGE (Speedy Ancestral Recombination Graph Estimator) and use it to build a genome-wide ARG of both modern human and archaic hominin genomes. SARGE can run on thousands of phased genomes, makes no prior assumptions other than parsimony, heuristically estimates branch lengths, and avoids making inferences about unobserved relationships by leaving polytomies in output trees. We validate SARGE using simulated data and demonstrate that it has high specificity compared to existing methods in reconstructing the topology of trees, making it suitable for identifying archaic admixture segments. To achieve this high specificity, SARGE avoids describing some relationships in output trees, resulting in lower sensitivity than existing methods.
We run SARGE on a panel of 279 modern human genomes, two high-coverage Neanderthal genomes, and one high-coverage Denisovan genome. Using the resulting ARG, we map Neanderthal and Denisovan ancestry, ILS, and the absence of both across modern human genomes. We find evidence of at least one wave of Neanderthal admixture into the ancestors of all non-Africans. We also identify several long and deeply divergent Neanderthal haplotype blocks that are specific to some human populations. We find support for the hypothesis that Denisovan-like ancestry is the result of multiple introgression events from different source populations (9, 10). We also detect an excess of Neanderthal and Denisovan haplotype blocks unique to South Asian genomes. Last, we pinpoint human-specific changes likely to have been affected by selection since the split with archaic hominins, many of which are involved in brain development.
RESULTS
ARG algorithm
To build an ARG containing both modern human and archaic hominin genomes without the use of a demographic model or the need to infer ancestral haplotypes, we developed a parsimony-based ARG inference technique, SARGE. SARGE uses both shared derived alleles and inferred, shared ancestral recombination events to articulate trees (Fig. 1A and Supplementary Methods). SARGE uses the four-gamete test (11) to determine regions of recombination and the affected haplotypes. The crux of SARGE is a fast algorithm for choosing the branch movement(s) capable of explaining the highest number of discordant clades across a genomic segment that fails the four-gamete test. Once the branch movements, i.e., inferred ancestral recombinations, are determined, further definition of clades is possible. Thus, the trees are articulated by both shared alleles and shared ancestral recombination events (figs. S1 and S2 and Supplementary Methods). SARGE infers branch lengths via a heuristic method, compensating for mutation rate variation across the genome by comparing the number of mutations on each branch to the divergence to an outgroup genome in a fixed width region around each site (fig. S7 and Supplementary Methods).
Fig. 1Data structure and performance of SARGE on simulated data.
(A) Schematic of data structure. Top: Rectangles are “tree nodes” representing clades in trees. Each clade has member haplotypes (shown with letters A to G) and a start and end coordinate (blue numbers in brackets) determined by coordinates of single-nucleotide polymorphism (SNP) sites tagging the clade (yellow numbers in braces), along with a propagation distance parameter (100 in this example). Parent/child edges (vertical arrows) also have start and end coordinates determined by the nodes. Ovals are candidates for clades sharing an ancestral recombination event that can explain four-gamete test failures; colored edges indicate potential paths between tree nodes through candidate nodes that could explain four-gamete test failures (colors indicate types of paths). The candidate node with the most edges (here, AB) is eventually chosen as the most parsimonious branch movement, allowing for the inference of new nodes. The two trees at the bottom show the “solved” ancestral recombination event with the branch movement marked in red and all clades inferred without SNP data marked with yellow stars (haplotypes A and B share an ancestral recombination event; their ancestry is shared with haplotypes C, D, and G upstream of the recombination event and haplotype E downstream of it). The coordinates of the recombination event (blue numbers in brackets) are taken to be midway between the highest-coordinate upstream site (left side) and the lowest-coordinate downstream site (right side) involved in recombination. For a more detailed overview of the data structure, see figs. S3 to S5. (B) Accuracy of SARGE on simulated data (defined as percent of all clades correct according to the true ARG in the simulation), with increasing numbers of human-like haplotypes from an unstructured population. Error bars are one SD across five replicates. (C) Number of nodes per tree with increasing number of haplotypes in simulated data.
” data-icon-position=”” data-hide-link-title=”0″>
Fig. 1Data structure and performance of SARGE on simulated data.
(A) Schematic of data structure. Top: Rectangles are “tree nodes” representing clades in trees. Each clade has member haplotypes (shown with letters A to G) and a start and end coordinate (blue numbers in brackets) determined by coordinates of single-nucleotide polymorphism (SNP) sites tagging the clade (yellow numbers in braces), along with a propagation distance parameter (100 in this example). Parent/child edges (vertical arrows) also have start and end coordinates determined by the nodes. Ovals are candidates for clades sharing an ancestral recombination event that can explain four-gamete test failures; colored edges indicate potential paths between tree nodes through candidate nodes that could explain four-gamete test failures (colors indicate types of paths). The candidate node with the most edges (here, AB) is eventually chosen as the most parsimonious branch movement, allowing for the inference of new nodes. The two trees at the bottom show the “solved” ancestral recombination event with the branch movement marked in red and all clades inferred without SNP data marked with yellow stars (haplotypes A and B share an ancestral recombination event; their ancestry is shared with haplotypes C, D, and G upstream of the recombination event and haplotype E downstream of it). The coordinates of the recombination event (blue numbers in brackets) are taken to be midway between the highest-coordinate upstream site (left side) and the lowest-coordinate downstream site (right side) involved in recombination. For a more detailed overview of the data structure, see figs. S3 to S5. (B) Accuracy of SARGE on simulated data (defined as percent of all clades correct according to the true ARG in the simulation), with increasing numbers of human-like haplotypes from an unstructured population. Error bars are one SD across five replicates. (C) Number of nodes per tree with increasing number of haplotypes in simulated data.
In the interest of parsimony, our method attempts to infer a set of ancestral recombination events that each explains as many four-gamete test failures as possible. Because the four-gamete test is known to underestimate the true number of ancestral recombination events (12, 13), SARGE will systematically underestimate the true number of ancestral recombination events in a dataset by design. Because of this, SARGE is not well suited to certain tasks, such as the creation of fine-grained recombination maps. We have attempted to mitigate cases where a clade in the ARG should be broken by an unobserved ancestral recombination event, however, by introducing a propagation distance parameter that limits the genomic distance over which each observed clade is allowed to persist (Fig. 1A and Supplementary Methods).
SARGE is scalable to large datasets and achieves higher specificity than many other methods at the cost of lower sensitivity, by leaving uncertainty (polytomies) in the output data. Using simulated data, we find that SARGE runs quickly (figs. S8D and S10), requires little memory, and has 78.93% specificity [95% confidence interval (CI), 78.09 to 78.95%] on average across a range of simulated datasets that include between 50 and 500 haplotypes (see Supplementary Methods). SARGE is at least as specific as alternative techniques (fig. S9, A and C). Conversely, SARGE’s sensitivity (25.36%; 95% CI, 25.32 to 25.40%) is lower than that of other methods (fig. S9, B and D), as SARGE leaves an increasingly large number of polytomies in output trees as the number of input haplotypes increases (Fig. 1, B and C). As expected, SARGE (as well as similar techniques) performs best when the mutation to recombination rate ratio is high, as this makes clades easier to detect (figs. S11 and S12) and suffers slightly in accuracy with increasing amounts of population structure (fig. S13).
We also find that the sensitivity of SARGE can be increased by increasing the propagation distance parameter (see Supplementary Text and fig. S15), that missing clades are likely to be small clades that are likely to be close to the leaves of trees (see Supplementary Text and fig. S16), and that incorrectly inferred clades tend to be within a few kilobases of sites at which those clades exist in truth (see Supplementary Text and fig. S17). We also find, using simulated data, that the SARGE’s branch lengths do not appear to be systematically biased upward or downward (see Supplementary Text and fig. S18).
We ran SARGE on 279 phased human genomes from the Simons Genome Diversity Project (SGDP) (14), together with two high-coverage Neanderthal genomes (1, 15) and one high-coverage Denisovan genome (16). In our analyses, we relied on modern human population labels defined by the SGDP for many analyses, but we split sub-Saharan Africans into one population containing only the most deeply diverged lineages (Biaka, Mbuti, and Khomani-San), which we call “Africa-MBK,” and the remaining genomes (“Africa”). Using these data, we find that the completeness of trees in the ARG (the extent to which all possible clades are present rather than in polytomies) is positively correlated with the local mutation rate to recombination rate ratio (fig. S20A; Spearman’s rho = 0.40; P < 2.2 × 10⁻¹⁶) and that the number of inferred ancestral recombination events per genomic window agrees with a previously published population recombination map (17) (fig. S20B; Spearman’s rho = 0.46; P < 2.2 × 10⁻¹⁶), as expected. Estimates of the mean TMRCA of pairs of haplotypes, taken across all trees, were also concordant with prior knowledge (Fig. 2A).
Fig. 2Performance of SARGE on SGDP and archaic hominin dataset.
(A) Pairwise coalescence times for randomly sampled sets of up to 10 pairs of phased genome haplotypes per population (every possible pair was considered for archaic hominins, since fewer genomes were available). Values are calibrated using a 13-Ma human-chimp divergence time (see Supplementary Methods) and averaged across every variable site in the dataset, error bars show one SD, and branch shortening values for archaic samples were incorporated into calculations using mean values reported in (1). The lower value for humans comes from removing archaic-admixed clades from trees. (B) UPGMA (unweighted pair group method with arithmetic mean) trees computed using nucleotide diversity from SNP data (top and left) against similarity matrix from shared recombination events inferred by SARGE. Light yellow boxes (similar groups) are Native Americans and Papuans. (C) Average similarity between Orcadian haplotypes in the SGDP panel and other European haplotypes calculated on the basis of the number of shared ancestral recombination events. The best matches are in England, Iceland, and Norway, as expected.
” data-icon-position=”” data-hide-link-title=”0″>
Fig. 2Performance of SARGE on SGDP and archaic hominin dataset.
(A) Pairwise coalescence times for randomly sampled sets of up to 10 pairs of phased genome haplotypes per population (every possible pair was considered for archaic hominins, since fewer genomes were available). Values are calibrated using a 13-Ma human-chimp divergence time (see Supplementary Methods) and averaged across every variable site in the dataset, error bars show one SD, and branch shortening values for archaic samples were incorporated into calculations using mean values reported in (1). The lower value for humans comes from removing archaic-admixed clades from trees. (B) UPGMA (unweighted pair group method with arithmetic mean) trees computed using nucleotide diversity from SNP data (top and left) against similarity matrix from shared recombination events inferred by SARGE. Light yellow boxes (similar groups) are Native Americans and Papuans. (C) Average similarity between Orcadian haplotypes in the SGDP panel and other European haplotypes calculated on the basis of the number of shared ancestral recombination events. The best matches are in England, Iceland, and Norway, as expected.
Using these data, we found SARGE’s inferences of ancestral recombination events to be accurate. Because SARGE articulates tree clades using either shared allelic variation or shared inferred ancestral recombination, it is possible to test the concordance of trees made from each source. On average, 13.2% of clades in the ARG are known only from inference of shared ancestral recombination events and not by the presence of a shared, derived allele. We created a similarity score between every pair of phased human genome haplotypes in our dataset based on how often the haplotypes share ancestral recombination events. This score recapitulates relationships among humans known from single-nucleotide polymorphism (SNP) data alone (Fig. 2, B and C; Pearson’s r2 with scores from SNP data = 0.989; P < 2.2 × 10⁻¹⁶). We note that genomes with the poorest correlation between SNP-based and recombination-based similarity scores to other genomes are those most likely to contain phasing errors (table S1).
Archaic hominin admixture
We used our ARG to find regions of each phased human genome that derived from admixture with archaic hominins (see Supplementary Methods and fig. S24). If humans and the archaic hominins in our panel were in populations that had sorted their lineages, then this exercise would be simple with a complete and correct ARG. However, since human genome regions are often within a clade that includes hominin haplotypes due to ILS, finding admixed segments requires analysis beyond simply finding clades that unite some human and archaic hominin haplotypes.
We started by selecting clades from ARG trees that united some modern humans with archaic hominins to the exclusion of some other modern humans. We then assigned each human genome haplotype in each such clade as putative Neanderthal, Denisovan, or ambiguous ancestry, depending on whether the clade contained Neanderthal, Denisovan, or both types of haplotypes. We then performed several filtering steps to remove these clades likely to result from ILS. First, we removed any clades that included more than 10% of the Africa-MBK haplotypes from the most basal human lineages, which are unlikely to be admixed. We then discarded clades that persisted for a short distance along the chromosome (which likely represent older haplotypes broken down over time by recombination) or in which the TMRCA between modern humans and archaic hominins was high (see Supplementary Methods and fig. S24). This ascertainment strategy was designed to identify haplotype blocks that we could confidently identify as archaic-introgressed and therefore likely underestimated the true extent of admixture across the genome. Because our method relies on both the haplotype block length and the TMRCA between admixed and introgressor haplotypes to identify admixed segments, we were able to identify some haplotypes that resemble archaic admixture in modern humans but that have relatively high sequence divergence to published archaic genomes (manifesting as high TMRCAs between archaic and modern genomes within these segments).
Using the resulting maps, we calculated genome-wide percent admixture estimates across populations and compared them to
f̂
estimates based on the population-wide D statistic (18, 19) using basal Africa-MBK lineages as an outgroup. Since our alleles were polarized relative to the chimpanzee genome and only sites with derived alleles present in hominins were considered, our calculations were of the form D(Africa-MBK, Test, Introgressor, Chimpanzee) / D(Africa-MBK, Introgressor1, Introgressor2, Chimpanzee), where Introgressor1 and Introgressor2 were randomly chosen subsets of half of the introgressor (Neanderthal or Denisovan) haplotypes and the derived allele frequency in chimpanzee was set to 0 at all sites in our dataset. ARG-based estimates are similar to, but lower than, D statistic–based estimates in all non-African genomes, which we expected because of our aggressive filtering strategy for eliminating ILS (see Supplementary Methods). We detected slightly more admixture in sub-Saharan Africans (excluding Africa-MBK) than using the D statistic (Fig. 3A), even when considering the lower end of 95% confidence weighted block jackknife intervals (table S2). We note that a recent study that used an outgroup-free method to detect Neanderthal ancestry blocks in human genomes also found a higher average amount of Neanderthal ancestry in African genomes than has been previously reported (20). As another quality check, we compared our maps of Neanderthal ancestry to those published in prior studies (20–23). We found that maps produced by SARGE are about as concordant with the published maps as the published maps are with each other (fig. S25).
Fig. 3Neanderthal ancestry inferred in modern humans.
(A) Genome-wide percent Neanderthal, Denisovan, and ambiguous (either Neanderthal or Denisovan) across SGDP populations, using the ARG and an estimator based on the D statistic. D statistic calculations considered only one archaic population at a time as introgressor and thus do not detect ambiguous ancestry and also might count some Denisovan ancestry as Neanderthal and vice versa. (B) For individual phased human genome haplotypes (points), mean TMRCA with Neanderthal in Neanderthal haplotype blocks (y axis) and mean Neanderthal haplotype block length (x axis) for all Neanderthal-introgressed haplotypes. TMRCA calculations assume a total of 6.5-Ma human-chimpanzee divergence and branch shortening values from (1), with a mutation rate of 1 × 10⁻⁹ per site per year. bp, base pair. (C) Overall number Neanderthal haplotype blocks versus geographically restricted (unique to a 3000-km radius) Neanderthal haplotype blocks. (D) Same as (B), but limited to geographically restricted (unique to a 3000-km radius) Neanderthal haplotype blocks. Only haplotypes with more than 10 geographically restricted segments are shown.
” data-icon-position=”” data-hide-link-title=”0″>
Fig. 3Neanderthal ancestry inferred in modern humans.
(A) Genome-wide percent Neanderthal, Denisovan, and ambiguous (either Neanderthal or Denisovan) across SGDP populations, using the ARG and an estimator based on the D statistic. D statistic calculations considered only one archaic population at a time as introgressor and thus do not detect ambiguous ancestry and also might count some Denisovan ancestry as Neanderthal and vice versa. (B) For individual phased human genome haplotypes (points), mean TMRCA with Neanderthal in Neanderthal haplotype blocks (y axis) and mean Neanderthal haplotype block length (x axis) for all Neanderthal-introgressed haplotypes. TMRCA calculations assume a total of 6.5-Ma human-chimpanzee divergence and branch shortening values from (1), with a mutation rate of 1 × 10⁻⁹ per site per year. bp, base pair. (C) Overall number Neanderthal haplotype blocks versus geographically restricted (unique to a 3000-km radius) Neanderthal haplotype blocks. (D) Same as (B), but limited to geographically restricted (unique to a 3000-km radius) Neanderthal haplotype blocks. Only haplotypes with more than 10 geographically restricted segments are shown.
We next looked for population-specific differences in archaic hominin ancestry in modern humans. Lengths of archaic haplotype segments and the TMRCA to admixer across those segments are both affected by the time of admixture and the divergence between the true admixers and available archaic hominin genomes. We therefore computed the mean of these two values for each ancestry type per phased genome haplotype and compared them across individuals from different populations to look for evidence of distinctive, population-specific admixture events. This analysis revealed distinctive population-specific patterns for Neanderthal and Denisovan ancestry, and many pairwise comparisons of these values between populations are significant (table S3). Segments of ambiguous ancestry produce a pattern resembling a mixture of Neanderthal and Denisovan ancestry, as expected (Fig. 3, B to D, and figs. S26, S28, S37, and S38). We caution, however, that our approach can artificially shorten haplotype block lengths (see Supplementary Methods and figs. S21 and S22), especially for populations such as Papuans and Australians that were absent from the 1000 Genomes Project panel (24) that was used for phasing (14). Nonetheless, Neanderthal haplotype block lengths in Oceania are not significantly shorter than in other populations (Fig. 3B), and incorrect phasing in archaic genomes does not appear to negatively affect results of admixture scans using simulated data (see Supplementary Text).
As expected, the ARG classifies a smaller fraction (0.096 to 0.46%) of sub-Saharan African genomes (excluding Mozabite and Saharawi individuals) as resulting from Neanderthal admixture compared to non-African genomes (0.73 to 1.3%). The haplotype segments of African genomes that are grouped together in clades with Neanderthal haplotypes are distinctive from the haplotype segments found in the genomes of people with non-African ancestry (Fig. 3B and fig. S26A). Namely, the African haplotypes are more dissimilar to the Neanderthal haplotypes with which they are grouped and tend to be shorter. These observations are qualitatively consistent with the model wherein genetic drift may group Neanderthal and African haplotypes, independent of a specific admixture event. It is also possible that these haplotypes are the result of true introgression events from unknown archaic hominins distantly related to the Neanderthal/Denisovan lineage (25). Another recent study using an inferred ARG also found mysterious, divergent haplotypes within sub-Saharan Africans that resembled unknown archaic introgression (7).
Unexpectedly, however, two of the SGDP African populations, Masai and Somali, are intermediate between non-African and African genomes when measuring lengths of archaic haplotype segments and TMRCA to admixers within them (Fig. 3B). These Neanderthal haplotype blocks may have originated in ancient European migrants to eastern Africa (26) and spread beyond eastern Africa through gene flow, which is known to have affected even the basal Africa-MBK lineages (27).
To test this hypothesis, we recomputed the mean length and TMRCA of admixer genomes within archaic-introgressed haplotype segments across all individuals, using only geographically restricted segments. We defined these as any archaic haplotype segments found only in genomes that were sampled within a 3000-km radius of each other (using geodesic distance between sampling coordinates). This analysis showed Masai and Somali genomes to have a comparable number of geographically restricted Neanderthal haplotypes to most other African genomes (Fig. 3C), with similar haplotype block lengths and TMRCAs to admixers within these geographically restricted haplotypes (Fig. 3D). This observation is concordant with the idea that the unusual Neanderthal haplotypes in these populations originated in Eurasian migrants.
Outside of Africa, our Neanderthal introgression maps largely agree with prior studies. We detect a mean TMRCA to Neanderthal of about 74 ka ago across all Neanderthal haplotype blocks in non-African populations, using published corrections for branch shortening in the archaic genomes (1). This value is consistent with published estimates of Neanderthal admixture times and the phylogenetic distance between the Vindija33.19 Neanderthal and the introgressing Neanderthal calculated by a recent study (28). The mean TMRCA between genomic segments detected as Neanderthal admixture segments and the Neanderthal itself is consistent within about 5000 years for all populations outside of Africa (Fig. 3B). We see slightly more Neanderthal ancestry in Central Asia, East Asia, and the Americas than in Europe, South Asia, and Southwest Asia (Fig. 3A). We also find more geographically restricted Neanderthal haplotype blocks in South Asia than elsewhere in mainland Eurasia, and the fewest geographically restricted Neanderthal haplotype blocks in the Americas (Fig. 3C and fig. S35).
Humans in Central and East Asia are known to have elevated Neanderthal ancestry compared to other populations (22). However, there is debate over whether this elevated Neanderthal ancestry is due to smaller past population size relative to other groups and the resulting stronger effect of genetic drift (22) or to additional pulses of Neanderthal admixture specific to these populations (9, 29). Although we detect more Neanderthal ancestry in Central and East Asians than in West Eurasians, we detect a similar number of geographically restricted haplotype blocks (unique to a 3000-km radius) in both groups (Fig. 3C). Further, Neanderthal haplotype blocks are shorter on average and therefore older in Central and East Asians than in West Eurasians (Fig. 3B). This implies that the excess Neanderthal ancestry in Central and East Asians mostly comprises broadly shared haplotype blocks from introgression common to all non-Africans, consistent with the drift scenario. Another recent study (20) suggested that excess Neanderthal ancestry in Central and East Asians could be mostly due to underestimating Neanderthal ancestry in West Eurasians as a result of using sub-Saharan Africans, who share some Neanderthal ancestry with West Eurasians, as a model unadmixed outgroup. We reject this explanation because removing Neanderthal haplotypes from West Eurasians would likely increase the number of geographically restricted Neanderthal haplotypes in Asians, contrary to our observation. Furthermore, South Asians appear to have a comparable amount of Neanderthal ancestry to West Eurasians (Fig. 3, B and C), despite sharing few Neanderthal haplotype blocks with Africans relative to West Eurasians (fig. S37A). Last, because our strategy for ascertaining Neanderthal haplotype used only Mbuti, Biaka, and Khomani-San genomes as an outgroup and allowed up to 10% of these genomes to have Neanderthal ancestry, we do not believe our results were significantly biased by our choice of outgroup. This is further demonstrated by the fact that we detect a non-negligible amount of Neanderthal ancestry in all African groups (table S2).
Aside from these broadly shared haplotype blocks, we also observe geographically restricted Neanderthal haplotype blocks in each non-African population in our panel. These population-specific haplotype blocks tend to be longer than the shared haplotype blocks and to have an older TMRCA to the Neanderthal genome than the broadly shared haplotype blocks (Fig. 3D, compared to all blocks shown in Fig. 3B). These observations suggest that the population-specific haplotype blocks may be the result of more recent population-specific Neanderthal admixture, as has recently been suggested (26–28, 30).
We next investigated population-specific patterns within Denisovan ancestry segments and found that these segments probably originate from admixture with multiple, divergent individuals that were distantly related to the Denisovan genome. This implies that the Denisovan genome is not a good model for the actual population that admixed with humans with “Denisovan” ancestry. Prior studies have suggested that Denisovan-like haplotype blocks in humans have two or three distinct sources with different levels of divergence to the Denisovan genome, with the best-matching haplotype blocks in East Asia (9, 10). We uncover the same signal: Geographically restricted Denisovan haplotype blocks have the lowest TMRCA to the Denisovan genome in East Asian genomes (mean TMRCA to Denisovan of 125 ka ago) (figs. S26 and S27).
Unexpectedly, we detected many Neanderthal and Denisovan-like haplotype blocks that are unique to South Asia (Fig. 3C and figs. S26C, S45, S35, and S36) and many Neanderthal haplotype blocks that are unique to Oceania (Fig. 3C and figs. S44 and S35). These geographically restricted Neanderthal haplotype blocks are no more divergent to the Neanderthal genome than those specific to other populations (Fig. 3D), complicating any interpretation of these regions.
Genomic regions free of admixture and ILS
Our ARG strategy allows us to bin the human genome into regions containing archaic admixture in at least some humans, regions of ILS, and regions free of both archaic admixture and ILS in all humans (hereafter archaic “deserts”). We find that approximately 7% of the human autosomal genome is human-unique and free of both admixture and ILS. Roughly 50% of the human genome contains regions where one or more humans has archaic ancestry obtained through admixture. If deserts are further restricted to regions that contain a high-frequency, human-specific derived allele, i.e., a substitution that can be assigned to the human lineage (hereafter “human-specific regions”), then these comprise only 1.5% of the assayed genome (Fig. 4A). Despite comprising very little of the genome, however, human-specific regions are significantly enriched for genes, exons, and regulatory element binding sites, while deserts are enriched for both genes and regulatory element binding sites (table S4). In line with previous studies (21, 31), we find admixed regions to be depleted of genes. Regions of ILS are enriched for overlap with genes but significantly depleted of exons (table S4).
Fig. 4Extent of deserts of archaic hominin ancestry.
(A) Left: In the SGDP dataset, fractions of the genome where any individual has archaic ancestry (admixture), where any individual is incompletely sorted with archaic hominin lineages but where there is no archaic admixture (ILS), where there is no evidence of either admixture or ILS with archaic hominins (deserts), and where there is a fixed derived allele private to and shared by all humans (human-specific regions). Right: The same values from a simulated dataset with single pulses of Neanderthal and Denisovan admixture, both with an admixture proportion (2%) that produced reasonable amounts of archaic ancestry per individual genome (fig. S47C). (B) For random subsamples of the SGDP dataset, along with the full dataset, fractions of the genome comprising deserts, deserts filtered for candidate archaic alleles using another dataset, and human-specific regions are shown. The points on the far right (full dataset) correspond to the desert and ILS bars in the left panel of (A).
” data-icon-position=”” data-hide-link-title=”0″>
Fig. 4Extent of deserts of archaic hominin ancestry.
(A) Left: In the SGDP dataset, fractions of the genome where any individual has archaic ancestry (admixture), where any individual is incompletely sorted with archaic hominin lineages but where there is no archaic admixture (ILS), where there is no evidence of either admixture or ILS with archaic hominins (deserts), and where there is a fixed derived allele private to and shared by all humans (human-specific regions). Right: The same values from a simulated dataset with single pulses of Neanderthal and Denisovan admixture, both with an admixture proportion (2%) that produced reasonable amounts of archaic ancestry per individual genome (fig. S47C). (B) For random subsamples of the SGDP dataset, along with the full dataset, fractions of the genome comprising deserts, deserts filtered for candidate archaic alleles using another dataset, and human-specific regions are shown. The points on the far right (full dataset) correspond to the desert and ILS bars in the left panel of (A).
To obtain an expectation of the extent of these different types of genomic regions, we ran a series of coalescent simulations with different amounts of archaic hominin admixture, as well as with no admixture (see Supplementary Methods and Supplementary Text). Our observation in the real data, which only 7% of the autosomal genome is free of both archaic admixture and ILS, is consistent with the results of a simulation that resulted in both higher archaic ancestry estimates per individual and more variability in individual archaic ancestry estimates than we observed in real data (Fig. 4A, Supplementary Text, and fig. S47). Two nonmutually exclusive explanations for this difference are (i) the existence of more, geographically limited, archaic hominin admixture events than the two we modeled (see Supplementary Text) and (ii) purifying selection acting against deleterious alleles found within archaic admixed segments (32). Under the model including selection, epistasis may be important, as the strength of selection against archaic alleles would vary depending on which archaic alleles are present in each human population.
The power to detect deserts, i.e., regions in which no human carries a haplotype shared with an archaic hominin by ILS or admixture, can be expected to be affected by the number of human genomes available for analysis. To be certain that we have found the true extent of archaic deserts, we inferred ARGs over random subsamples of the human panel, computing the extent of deserts and human-specific regions for each (Fig. 4B). We were able to recover the full extent of deserts using a subsample of 100 haplotypes, less than half the size of the full panel, suggesting that the panel is sufficiently large.
Given the limited sensitivity of our method compared to alternatives, we also compared the ability of SARGE, Relate, and tsinfer to recover true desert regions in demographic simulations with different numbers of haplotypes (see Supplementary Methods). We found that all methods, including SARGE, tended to overestimate the extent of desert regions, with this tendency increased in the larger dataset (figs. S48 and S49), further highlighting the unexpectedly small fraction of the human genome found to be in these deserts in the actual human genome data.
Timing of human-specific mutations
Given a clade of interest, mutations shared by all members of the clade must have arisen between that clade’s TMRCA and its parent clade’s TMRCA. Using this logic, and using the local divergence to the chimpanzee genome in the surrounding region of each tree to calibrate the local mutation rate, assuming human-chimpanzee divergence 13 Ma ago (see Supplementary Text) (18), we estimated ages of all human-specific mutations within deserts. For a schematic of how branch lengths were estimated, see fig. S7. Because the order of mutations along any given branch is unknowable, we took the midpoint of each branch, in years, to be the approximate age of each mutation. Combining these dates with a catalog of high-frequency, human-specific mutations and other annotation data (see Supplementary Methods) allowed us to construct a picture of human-specific evolutionary changes through time. We note that our date estimates rely on the assumption of a constant local mutation rate around each locus across all lineages since human/chimpanzee divergence. Some studies have found evidence for mutation rate heterogeneity in different hominoid lineages, with mutations accumulating more slowly in humans than in other apes, e.g., (33). In this case, some of our TMRCA estimates could be biased downward, as more time would have been required to accumulate the mutations tagging recently formed clades than those that occurred branches closer to the root.
We first examined whether there were one or multiple bursts of human-specific adaptive changes since divergence with Neanderthals and Denisovans. We compiled the ages of all fixed or nearly fixed human-specific derived mutations within archaic hominin deserts that either were annotated as nonsynonymous substitutions (34) or fell within annotated regulatory element binding sites. The age distribution of these mutations is centered around 600 ka ago (Fig. 5A).
Fig. 5Approximate ages and consequences of fixed human-specific derived mutations.
(A) Ages of candidate human-specific functional mutations (nonsynonymous substitutions and mutations within regulatory element binding sites) inferred by SARGE within desert regions (free of ILS and admixture between archaic hominins and modern humans). (B) For interacting pairs of genes in the STRING database (35) for which candidate human-specific functional mutations affect both genes, the ages of the two mutations are shown. (C) For each candidate human-specific functional mutation, the length of the surrounding desert region (x axis) and inferred mutation age (y axis) are shown. Mutations for which SARGE did not infer a date (mutations within CpG sites or for which the ancestral allele was unknown) are shown in the bottom panel. Mutations were scored on the basis of length of desert and age; genes with regulatory mutations in the top 99.5th percentile of this distribution, or nonsynonymous mutations in the top 95th percentile, are shown, with nonsynonymous changes in bold.
” data-icon-position=”” data-hide-link-title=”0″>
Fig. 5Approximate ages and consequences of fixed human-specific derived mutations.
(A) Ages of candidate human-specific functional mutations (nonsynonymous substitutions and mutations within regulatory element binding sites) inferred by SARGE within desert regions (free of ILS and admixture between archaic hominins and modern humans). (B) For interacting pairs of genes in the STRING database (35) for which candidate human-specific functional mutations affect both genes, the ages of the two mutations are shown. (C) For each candidate human-specific functional mutation, the length of the surrounding desert region (x axis) and inferred mutation age (y axis) are shown. Mutations for which SARGE did not infer a date (mutations within CpG sites or for which the ancestral allele was unknown) are shown in the bottom panel. Mutations were scored on the basis of length of desert and age; genes with regulatory mutations in the top 99.5th percentile of this distribution, or nonsynonymous mutations in the top 95th percentile, are shown, with nonsynonymous changes in bold.
We then compared the ages of mutations affecting pairs of genes that interact, according to the STRING database (35), to see whether any clustered around specific time points (see Supplementary Methods). We find two distinct bursts of these mutations, one concentrated around 600 ka ago and another around 200 ka ago (Fig. 5B). We note that, because many of our human-specific genes are likely functionally important and purifying selection can decrease genetic diversity, some of the time estimates for these mutations may be biased downward.
Estimating how and when the modern human lineage arose remains controversial. Dating the oldest population split within modern humans using genetic data has suggested times as recent as 200 to 100 ka ago (36, 37). Archeological evidence paints a more complex and older story; however, a recent study reported human remains with many modern features but archaic cranial morphology dated to about 315 ka ago (38), suggesting that not all human-specific traits arose at the same time. Other studies have found that accumulation of derived morphological features in humans occurred in approximately three periods, whose boundaries correspond roughly to the timing of mutational bursts we found (39).
Functional consequences of human-specific mutations
Comparison of the human and extinct hominin genomes could reveal instances of positive selection that are undetectable via allele frequency or haplotype-based analyses within modern humans or through comparative genomics between humans and other primate genomes (40). The ARG framework is an attractive approach as it pinpoints truly human-specific genomic regions unaffected by either admixture of ILS.
We performed a gene ontology (41) enrichment analysis on the human-specific haplotype regions that accounted for the lengths of candidate genes (see Supplementary Methods) and found these regions to be heavily enriched for genes related to neuron growth, synapse assembly and function, and cell adhesion (table S5). We note that this may occur because of positive selection in the ancestors of all humans, strong purifying selection that reduces the TMRCA within humans so that it excludes extinct hominins, or a combination of both. Further, this test does not suggest specific functional consequences of specific mutations.
We ordered human-specific derived mutations within desert regions found in our ARG by the strength of evidence that they were targeted by selection. To this end, we first sought to limit analysis to potentially functionally relevant mutations, defined as mutations that either caused a nonsynonymous substitution relative to archaic hominin genomes or fell within annotated binding sites for regulatory elements known to affect specific genes (see Supplementary Methods). We developed a simple score for each mutation based on its inferred age, where available, and the length of the surrounding desert region (Fig. 5C). The rationale for this approach is that older human-specific substitutions should be in shorter haplotypes as they would have undergone more generations of recombination. Mutations in haplotype regions that run counter to this expectation are a priori more likely to have been affected by positive selection. This approach is similar to the recently described extended lineage sorting (ELS) scan (42), which prioritized long genomic intervals where modern human and archaic hominin lineages are completely sorted. Unlike the ELS method, however, our method only considers alleles that are fixed in modern humans, Our model also does not use a hidden Markov model to smooth transitions between sorted and unsorted haplotypes.
Several patterns emerge when considering genes with high-scoring human-specific mutations, and we highlight some of these key findings. Gene ontology terms related to mRNA splicing, processing, and export are enriched in genes with high-scoring mutations (table S7). Of these, we find a regulatory mutation affecting one—LUC7L3—that is somewhat tissue specific (tau, a measure of tissue specificity scaled from 0 to 1 = 0.713), most highly expressed in cerebellar tissue, and annotated to be involved in splice site selection. Its paralog LUC7L and the gene KHDC4, both of which also have high-scoring (top 50th percentile) regulatory mutations, are involved in the same process. In addition, the gene NOVA1, which harbors a nonsynonymous mutation in the top 95th percentile of our score distribution (Fig. 5C), is a neuronal splicing factor that regulates splicing of genes involved in synapse formation within the brain (43).
Other types of genes, largely related to brain function and development, appear to be affected by high-scoring mutations. Many genes localized to the centrosome and mitotic spindle are involved in maintaining the polarity of dividing neuroblasts, and some mutations affecting these genes are thought to be critical for the development of the human neocortex (44). We find the term “asymmetric neuroblast division” to be enriched in high-scoring genes (table S7). Among individual genes, we find a high-scoring nonsynonymous mutation affecting the centrosomal protein RABL6, which is highly expressed in cerebellar tissue and overexpressed in cancer (45) and a high-scoring regulatory mutation affecting INCENP, a protein crucial for cytokinesis that localizes to the mitotic spindle and centromere (46). Axon pathfinding is another process suggested to have been targeted by human-specific changes; the gene PIEZO1 is involved in this process (47) and harbors a high-scoring nonsynonymous mutation. In addition, the protocadherin PCDHGB7, which contains a nonsynonymous substitution within a long desert region but which we could not date, is a member of a gene family that generates neuronal cell surface identity and is thought to help guide growing neurites (48). In addition to these, we find a number of other mutations potentially affecting genes involved in histone acetylation, neural cell migration, and the clearing of toxic substances from the brain (see Supplementary Text).
DISCUSSION
We implemented a new ARG inference approach, SARGE, and used it to build the first genome-wide ARG of both human and archaic hominin genomes. Analysis of the topology of these ARG trees confirms prior findings about archaic hominin admixture but with important new biological insights. For one, we find that a low fraction, 1.5 to 7%, of the human genome is uniquely human, with the remainder comprising lineages shared with archaic hominins from either ILS or admixture. This small human-specific fraction of the genome is enriched for genes related to neural development and function. We also find evidence for multiple waves of human-specific mutations that occurred through time, suggesting that the modern human phenotype may have developed in stages.
In addition to Neanderthal admixture into the ancestors of all modern non-African populations, we find evidence for other, population-specific episodes of admixture throughout Eurasia. The TMRCA to these population-specific Neanderthal haplotype blocks is deeper than the TMRCA to the Neanderthal haplotype blocks shared by all non-African populations. This deeper TMRCA suggests that Neanderthals contributing population-specific ancestry were less closely related to published (Altai and Vindija) Neanderthal genomes than were the Neanderthals that contributed the broadly shared Neanderthal haplotype blocks. We also find that Neanderthal ancestry is present to a smaller extent in some African genomes due to back-migration, consistent with other recent reports (20).
We note that our estimated TMRCA to Neanderthal within Neanderthal-introgressed segments in all non-African populations is recent, ~74 ka ago, and implies therefore that little genetic drift separates admixed humans from sequenced Neanderthals in these segments. This recent TMRCA suggests that the majority of Neanderthal ancestry in modern humans originated from Neanderthal gene flow into the ancestors of all non-Africans before populations diversified. It also suggests that at least one of the Neanderthal genomes used here is closely related to the Neanderthal(s) involved in this admixture event. The slightly elevated Neanderthal ancestry that others have described in Central and East Asian populations also appears to have originated in this first pulse, as Central and East Asian Neanderthal haplotypes are mostly shared with other, geographically distant populations. This observation favors the hypothesis that the increased Neanderthal ancestry in these populations relative to others is due to weaker selection against alleles that may be mildly deleterious (32), made possible because of smaller historical population sizes in this part of Eurasia, rather than to additional admixture events (22). Our evidence of many small-scale, population-specific admixture events, however, together with a simulation study that found a single-pulse admixture model followed by drift unable to explain the discrepancies in admixture proportions in European and Asian genomes (49), hints at a complex history of admixture throughout Eurasia not fully captured by either of these two hypotheses.
Last, the genomes of some Oceanian and other populations harbor genes from a population most closely related to the archaic Denisovan genome. The available Denisovan genome is less genetically similar to the admixing genome than the available Neanderthal genomes are to the admixing Neanderthals. While we are hopeful that future work may uncover a DNA-bearing fossil better representing the population involved in the Denisovan admixture, our approach allows identification of admixed regions that can be used to better describe the genome of the archaic hominin group involved in the admixture event. Larger panels of Denisovan admixed genomes may one day provide a nearly complete Denisovan genome scavenged in parts from the genomes of admixed human individuals.
The ARG also allows for prioritizing the selective importance of mutations specific to, and shared by, all modern humans by considering the TMRCAs of those mutations together with the lengths of their surrounding human-unique regions. Many of these selected human-specific mutations appear to affect genes involved in neural development and function, as well as RNA splicing. Using new tools for genome editing and brain organoid models for neural function, these mutations are obvious and important targets for experimental studies to determine what was selected in our human ancestors after divergence from our most closely related, extinct relatives.
MATERIALS AND METHODS
Data processing
We downloaded data from the SGDP panel (14), along with two Neanderthal (1, 15) genomes and one Denisovan (16) genome. The Simons data were downloaded in prephased form from https://sharehost.hms.harvard.edu/genetics/reich_lab/sgdp/phased_data/; phasing was performed using SHAPEIT2 (50). We note that the hosts of the data state that the genotypes they provide at sites lacking a homologous chimpanzee are unreliable; we discarded all these sites from analysis.
Existing variant call sets for the ancient samples were either created using a genotype caller that did not account for ancient DNA damage (15, 16) or were subjected to a mapability filter that discarded many sites in the genome (1). Because our method is sensitive to genotype errors and seeks to make inferences at every possible site in the genome, we chose to recall variants in these three genomes using the ancient DNA-aware genotype caller snpAD version 0.3.0 (51). For all snpAD runs, we required a minimum base quality of 25 and treated different types of libraries separately, separating uracil-DNA glycosylase (UDG)–treated and non–UDG-treated libraries in the case of the Vindija Neanderthal and separating single-stranded and double-stranded library data for the Altai Neanderthal and Denisovan.
Although the SGDP data were already phased, phasing posed a challenge for the Neanderthal and Denisovan data, for which there is no reference panel and for which DNA is fragmented into short segments. Fortunately, the comparatively low nucleotide diversity in these archaic hominins results in the presence of long runs of homozygosity, which are phased by definition. As an unbiased first step, we performed read-backed phasing using WhatsHap version 0.16 (52) (with default parameters, plus –ignore-read-groups). Before filtering SNPs for quality and coverage, this phased 722,828 of 11,746,838 heterozygous sites (6.2%) in the Altai Neanderthal, 346,992 of 48,083,469 heterozygous sites (0.7%) in the Vindija Neanderthal, and 514,575 of 33,951,346 heterozygous sites (1.5%) in the Denisovan. Many of the remaining, unconfidently phased heterozygous sites were excluded by other, later filtering steps; however, in our final, filtered dataset, we were left with only 1,677,774 of 49,876,210 total SNPs (3.4%) for which at least one archaic hominin individual was heterozygous and not phased by read-backed phasing.
Following read-backed phasing, we merged archaic hominin VCF files [using bcftools merge from bcftools version 1.8 (53)] and then phased the merged files using Eagle2.4 (54), with the 1000 Genomes Project data (24) as a reference panel. We used Eagle2’s default parameters but specified that it should not impute missing data (–noImpMissing) and that it should output alleles that it could not phase (–outputUnphased). After this, we randomly assigned both alleles at every unphased heterozygous site to one or the other haplotype. Although this decision, along with the use of a modern human reference panel, undoubtedly introduced haplotype switch errors, we deemed this preferable to excluding sites that were not confidently phased (which would require us to exclude data from all of the SGDP individuals at the same sites). To mitigate problems arising from this decision, we avoided performing any haplotype-specific analyses on the archaic hominin genomes. When creating maps of archaic hominin ancestry in modern humans, for example, we track only whether a modern human haplotype is in a clade with one or more archaic hominin haplotypes at each site but not which specific archaic hominin haplotype is in the clade. After running the ARG, we computed the discordance between similarity scores per genome haplotype computed using SNP data and computed using shared ancestral recombination events; this discordance should be largely driven by phasing switch errors, which can cause the inference of erroneous ancestral recombination events. We found that this discordance ranged from about 8× higher (in Denisovan) to 2 to 3× higher (in Neanderthals) in archaic hominins than in the most discordant human genomes (table S1).
We merged the phased archaic hominin files with the SGDP data, using bcftools merge with the –missing-to-ref option, and then used bcftools norm to remove duplicate alleles (-d). To avoid misidentifying all SGDP samples as homozygous reference at sites that were originally excluded from the SGDP dataset, we limited the variant call set for each chromosome to the sites between the first and last site in the SGDP data on that chromosome. To mitigate the same problem, we also removed any site for which all nonreference alleles in our SGDP data were private to archaic hominins but for which nonreference alleles were present in modern humans within the 1000 Genomes dataset (24). We then discarded all sites for which any individual had a missing genotype or genotype quality below 25 or for which any archaic sample fell within the upper or lower tail of its genome-wide coverage distribution (extracted from the VCF file). The allowed coverage ranges (determined by eye) were 23 to 70× for the Altai Neanderthal, 10 to 43× for the Denisovan, and 10 to 47× for the Vindija33.19 Neanderthal.
Last, we polarized our variant call set into ancestral and derived alleles, using the chimpanzee reference genome panTro4 (55) [mapped to hg19 by the UCSC Genome Browser team (56) and downloaded in AXT format] as an ancestral sequence, discarding any variant that was an indel, had more than two alleles, or lacked a known chimpanzee homolog. We chose panTro4 as an ancestral sequence rather than a composite ancestral sequence as some other studies have done [e.g., (57)] because it allowed us to more easily estimate branch lengths, at the cost of discarding some sites. In addition, because our approach assumes the infinite sites model of mutation, we excluded all CpG dinucleotide sites from analysis, as methylated cytosines in CpG dinucleotides are highly mutable and are thus more likely than other nucleotides to undergo repeated mutations (58).
ARG inference
We developed an ARG inference program called SARGE (available at https://github.com/nkschaefer/sarge), which is optimized for speed and low memory usage, in addition to making minimal model assumptions. SARGE assumes parsimony and the infinite sites model and uses the four-gamete test (11) as a central insight. SARGE avoids using statistical techniques to smooth branch lengths or infer clades, opting instead to describe only that which can be inferred directly from the input data. The result is a set of trees that contain polytomies and have relatively low-resolution branch lengths.
Our algorithm centers on the observation that a single tree cannot contain two clades that share members unless one is a superset of the other. We assume that every shared derived allele in our dataset defines a clade. It has been shown that, under this assumption, pairs of sites for which the inferred clades share members but for which neither is a superset of the other, mark ancestral recombination events, or breakpoints between different trees. This is referred to as the “four-haplotype test” or “four-gamete test” (3, 11). One could use this technique to map ancestral recombination events, which mark boundaries between trees, articulate trees using the sites within these boundaries. In practice, however, this can only produce minimally articulated trees. In the case of organisms with low nucleotide diversity, this is because there will not often be enough polymorphic sites between ancestral recombination breakpoints to observe many of the possible clades per tree. In the case of organisms with high nucleotide diversity, however, it will be possible to detect far more ancestral recombination events, thus making the size of “bins” between ancestral recombination breakpoints smaller and leading to the same problem.
Our algorithm therefore seeks to infer all relevant information about each ancestral recombination event. An ancestral recombination event can be conceptualized as a branch movement (3) and so each consists of a set of haplotypes moving from one clade in an upstream tree into a new clade in a downstream tree. Given two clades that share members, but for which neither is a superset of the other (henceforth described as a failure of the four-haplotype test), and assuming that this four-haplotype test failure describes only one ancestral recombination event, there are then three possible branch movements than can explain it (fig. S1). We refer to the clade in the upstream tree from which a subclade moved as α, the clade in the downstream tree into which a subclade moved as β, and the subclade that moved positions as γ. Four-haplotype test failures are possible between the following sets of clades (with the clade in the upstream tree listed first and the clade in the downstream tree listed second): α/α, α/β, and β/β. In the case of an upward branch movement, all four-haplotype test failures are α/α, and all four-haplotype test failures are of the type β/β in the case of downward branch movements. The members of the moving clade γ can then be inferred once the type of four-haplotype test failure is known. Denoting the members of the upstream clade as U and the members of the downstream clade as D, γ contains U ∖ D in the α/α case, U ∩ D in the α/β case, or D ∖ U in the β/β case.
If two trees that differ by an ancestral recombination event are known a priori, then we devised an algorithm to describe the ancestral recombination event by choosing the candidate branch movement(s) (γ clades) that explain the most four-haplotype test failures (see Supplementary Methods and fig. S2). We then created a data structure to store ARG nodes over the genomic ranges they span, using a maximum, preset “propagation distance” parameter that determines the maximum range of a node defined by a single SNP. We then developed an algorithm to continually create and adjust ARG nodes as input SNP data are read in order across the genome (see Supplementary Methods and fig. S3). When four-haplotype test failures are encountered, candidate γ clades are added to the data structure, and when all sites that can inform a given ancestral recombination event have been encountered, the most popular (parsimonious) γ clade is chosen and used to infer new ARG nodes (figs. S4 and S5). Our use of propagation distance parameter serves as a bound on computational complexity and memory requirements (see Supplementary Methods and fig. S6) and limiting the impact of incorrectly inferred clades on the rest of the data structure. SARGE produces a tree at every variable site in the input data, with branch lengths estimated heuristically from the mutations encountered on each branch, normalized relative to the branch length to an outgroup genome (see Supplementary Methods and fig. S7).
Quality control (QC) simulations
For the sake of assessing our and other ARG inference programs, we simulated sampling an increasing number of haplotypes from a single panmictic population with no history of growth or bottlenecks (QC simulations). Our QC simulations were performed using msprime (59). We chose a recombination rate of 1 centimorgan per megabase (cM/Mb) and a mutation rate of 1 × 10⁻⁹ per year with a 25-year generation time, giving a per-generation mutation rate of 2.5 × 10⁻⁸. In addition, we chose a heterozygosity value of 10.1 per 10,000 bases, comparable to the rate in modern sub-Saharan Africans (15). We simulated 1 Mb of sequence per run, running five replicates each of simulations with 50, 100, 200, 300, 400, 500, 600, 700, 800, 900, 1000, 2000, 3000, 4000, and 5000 haplotypes. The complete command used was mspms X 1 -t 1010.0 -r 404.0 1000000 --precision 6 –T, where X is the number of haplotypes. Whenever there were duplicate base positions in a simulated dataset, we ignored the allele data at all but the first occurrence of each position. We also repeated these simulations with a lower mutation rate of 1 × 10⁻⁸ per site per generation, to see how this affected SARGE’s ability to correctly infer clades. The mean sensitivity and specificity given in the Results section are computed on both of these sets of simulations, with numbers of haplotypes ranging from 50 to 500.
We then ran SARGE on each dataset with a propagation distance of 25,000 bases, along with tsinfer (8) (converting its output to a sequence of trees linked to specific variable sites), Relate (7) with the mutation rate set to that known from the simulation and with the haploid effective population size set to two times the simulation’s effective population size, and Rent+ (5) with the –t option to infer branch lengths. For each inferred tree, we loaded the tree output by msprime for the same variable site and defined the inferred ARG’s specificity as the fraction of all clades in all inferred trees that existed as clades in the msprime tree at the same sites. We also computed the sensitivity, defined as the fraction of all clades in true trees that existed as clades in the inferred ARGs. For the two methods, Relate and Rent+, that produced fully articulated trees (without polytomies), these two values were the same. Results of these QC simulations are shown in figs. S8 to S10.
We also repeated a similar set of simulations with the goal of assessing the effect of the mutation rate, the recombination rate, and population structure on the accuracy of SARGE, compared to Rent+, Relate, and tsinfer. To this end, we used the same base parameters (with a 2.5 × 10⁻⁸ per site per generation mutation rate) and chose 100 haplotypes for each simulation.
For testing the effect of heterozygosity, simulations were of the form mspms 100 1 -t X -r 202.0 1000000 --precision 6 -T with X = 505, 1010, 2020, 5050, and 10,100. We set the effective population size parameter in Relate to two times the effective population size in the simulation (the -t parameter divided by 1,000,000 bases) and ran SARGE with a 25-kb propagation distance on each. Results of these simulations are shown in fig. S11.
For testing the effect of the recombination rate, simulations were of the form mspms 100 1 -t 1010.0 -r X 1000000 --precision 6 -T with X = 202, 404, 808, 2020, and 4040. We set the effective population size parameter in Relate to 20,200 and ran SARGE with a 25-kb propagation distance on each. Results of these simulations are shown in fig. S12.
For testing population structure, in addition to the panmictic simulation, we ran one simulation with two populations that split 100 ka ago, another in which these both split into two additional populations 50 ka ago, and a third in which all four populations split into two more populations 25 ka ago, for a total of eight subpopulations. We sampled an equal number of haplotypes from each population for 100 total, except in the case of the eight-population simulation, in which we sampled either 10 or 15 haplotypes from each population, for a total of 100 haplotypes. The command for the two-population simulation was mspms 100 1 -t 1010.0 -I 2 50 50 -r 404.0 1000000 -ej 0.0990099009901 2 1 --precision 6 -T, the command for the four-population simulation was mspms 100 1 -t 1010.0 -I 4 25 25 25 25 -r 404.0 1000000 -ej 0.049504950495 3 1 -ej 0.049504950495 4 2 -ej 0.0990099009901 2 1 --precision 6 -T, and the command for the eight-population simulation was mspms 100 1 -t 1010.0 -I 8 10 15 10 15 10 15 10 15 -r 404.0 1000000 -ej 0.0247524752475 5 1 -ej 0.0247524752475 6 3 -ej 0.0247524752475 7 2 -ej 0.0247524752475 8 4 -ej 0.049504950495 3 1 -ej 0.049504950495 4 2 -ej 0.0990099009901 2 1 --precision 6 -T. We ran Relate with an effective population size parameter of 20,200 and SARGE with a 25-kb propagation distance parameter on each. Results of the simulations are shown in fig. S13.
We did another QC simulation that assessed the effect of a single population bottleneck on the sensitivity and specificity of all programs considered in this study. We chose the same parameters as in other QC simulations but simulated the effect of reducing Ne to ¼ its original value 80 ka ago. The command for this simulation was mspms 100 1 -t 1010.0 -r 4040.0 1000000 --precision 6 -G 17.50197 -eN 0.0792079207921 1 -T. Results of these simulations are shown in fig. S14.
We also used some of our QC simulations for other assessments. We used our initial QC simulation, including five replicates, with 100 sampled haplotypes to assess the effect of the propagation distance parameter of the accuracy of SARGE compared to tsinfer and Relate (fig. S15 and “Testing the propagation distance parameter” section in Supplementary Text). To show the effects of sample size on the properties of incorrectly inferred clades, we also used one of our QC simulations with 50 sampled haplotypes and another with 500 sampled haplotypes to explore the numbers of clades missing, correctly inferred, and incorrectly inferred in SARGE output trees by clade size (fig. S16) and to find the shortest distance along the simulated chromosome that each incorrectly inferred clade exists from a true clade with the same members (fig. S17 and “Properties of missing and incorrectly inferred clades” section in Supplementary Text).
Demographic simulations
Several of our other analyses and tests required simulated data more similar to our real data (a global panel of human genomes, plus one eastern Neanderthal, one western Neanderthal, and one Denisovan genome). We therefore created a second type of simulated dataset using a popular human demographic model.
We used scrm (60) for these simulations, providing branch shortening values for ancient samples. We combined a popular, three-population demographic model for modern humans (61) with populations meant to approximate the Altai (15) and Vindija (1) Neanderthals and the Altai Denisovan (16). We assumed a 1 cM/Mb recombination rate and a 0.5 × 10⁻⁹ per year mutation rate, along with a 25-year generation time, giving a per-generation mutation rate of 1.25 × 10⁻⁸. This mutation rate is different from that in the original description of the demographic model but concordant with more recent studies that measured divergence between modern and archaic hominins (1). In addition to the demographic model parameters listed in (61), we modeled a Neanderthal/human split time of 575 ka ago (15), an Altai/Vindija split time of 137.5 ka ago, a Neanderthal/Denisovan split of 420 ka ago, and modeled the heterozygosity in all Neanderthals as 1.6 × 10⁻⁴ and in Denisovans as 1.8 × 10⁻⁵ (1). We chose 100 ka ago as the divergence time between the Vindija and introgressing Neanderthal, no split between the introgressing and sampled Denisovan populations, and we modeled human/Neanderthal admixture as a single pulse 50 ka ago, in the population ancestral to both Europeans and Asians, and human/Denisovan admixture as a single pulse 20 ka ago, in the Asian population. We assigned 57 ka ago of missing evolution to the Vindija haplotypes, 123 ka ago of missing evolution to the Altai haplotypes, and 80 ka ago of missing evolution to the Denisovan haplotypes (1). Our simulated chromosome was 25 Mb long, and we sampled 2 haplotypes from each Neanderthal and Denisovan (but not the introgressing Neanderthal), as well as 150 haplotypes from each modern human population (African, Asian, and European) population, for a total of 450 modern human haplotypes. For the sake of simplicity ascertaining archaic introgressed haplotypes, we modeled no archaic introgression into Africans and set the gene flow parameters between Africans and other populations to zero.
We then ran five different simulations, varying the human/archaic admixture proportion in each (the admixture proportion was the same for both the Neanderthal and Denisovan admixture events). The admixture proportions we used were 1, 2, 5, and 10%. The full command for each run was scrm 456 1 -t 17253.7128713 -r 13802.970297 25000000 -T -I 7 150 150 150 0 0 0 0 -eI q 0 0 0 0 0 2 0 -eI 0.0891112545728 0 0 0 2 0 0 0 -eI 0.0579585395596 0 0 0 0 0 0 2 -n 1 1.68 -n 2 3.74 -n 3 7.29 -n 4 0.231834158238 -n 5 0.231834158238 -n 6 0.231834158238 -n 7 0.0260813428018 -eg 0 2 116.010723 -eg 0 3 160.246047 -m 2 3 2.797460 -m 3 2 2.797460 -ej 0.028985 3 2 -en 0.028985 2 0.287184 -em 0.028985 1 2 7.293140 -em 0.028985 2 1 7.293140 -es 0.0144896348899 3 [1-x] -ej 0.0144896348899 8 7 -es 0.0362240872247 2 [1-x] -ej 0.0362240872247 9 5 -ej 0.0724481744495 6 5 -ej 0.197963 2 1 -en 0.303501 1 1 -ej 0.099616239868 5 4 -ej 0.304282332688 7 4 -ej 0.416577003084 4 1, where [1-x] means one minus the admixture proportion in a given run. We again discarded all but the first instance of every unique base position in the output file, and we converted the “true” trees into SARGE format for running analyses.
We used the simulation with what we deemed was the most realistic admixture proportion (0.02) for other QC assessments of SARGE, including checking accuracy of inferred branch lengths (since SARGE requires knowledge of the TMRCA of all humans to convert branch lengths into years; see “Testing accuracy of inferred branch lengths” section in Supplementary Text), and testing the ability of SARGE, Relate, and tsinfer to recover the true extent of deserts of archaic hominin admixture and ILS across the simulated chromosome (see “Comparing sizes of deserts inferred using different methods” section in Supplementary Methods).
We also ran one smaller version of the demographic simulation, with a 0.05 admixture proportion and 20 haplotypes sampled per human population, for 60 total modern human haplotypes. We used this simulation along with the bigger simulation to assess haplotype block lengths in SARGE-inferred versus true ARGs, to assess the effects of sample size on inferred haplotype block length accuracy (fig. S21). We also used this simulation alongside the larger one to assess accuracy of inferred desert sizes (see “Comparing sizes of deserts inferred using different methods” section in Supplementary Methods and figs. S48 and S49).
Admixture scans
The central challenge of creating admixture maps is to disentangle ILS from admixture. Both processes create local trees in the genome that group candidate admixed haplotypes with admixer haplotypes. Clades resulting from ILS are older than those resulting from admixture; however, they should therefore persist for shorter stretches along the genome and have older TMRCAs. Clades resulting from ILS are separable from those resulting from admixture using these two metrics, although the low resolution of branch lengths in the inferred ARG makes this problem more difficult than when true branch lengths are known (fig. S19). Because of this, we established several filtering steps to distinguish ILS from admixed clades in our dataset.
To map Neanderthal and Denisovan ancestry, we first scanned through ARG output for all clades that grouped some modern human haplotypes with one or more admixer haplotypes (Neanderthal and/or Denisovan) to the exclusion of some other modern human haplotypes. Since SARGE produces many polytomies, this carries the risk of observing a parent of one or more true admixed clades, but not the true admixed clade. This would manifest as a clade containing many modern humans, in addition to one or more archaic hominins, and would falsely be interpreted as a very high-frequency archaic-introgressed haplotype. To mitigate this problem, we defined the Mbuti, Biaka, and Khomani-San genomes as an outgroup population (Africa-MBK) and discarded any clade that contained more than 10% of the outgroup members. We set this 10% threshold, rather than excluding all clades containing outgroup members, because of later filtering steps also designed to eliminate ILS clades. Next, we discarded any clades that persisted for less than 5 kb along the chromosome, as well as one extremely long haplotype that fell within a centromere, as annotated by the UCSC Genome Browser (56). For each clade that passed our selection criteria, we visited each nonarchaic hominin member and determined whether that member had candidate Neanderthal, Denisovan, or undetermined ancestry by assessing whether it was closer (by tree topology, ignoring branch lengths) to a Neanderthal or Denisovan haplotype, or equidistant to both.
We then computed the mean TMRCA between each human member and the candidate archaic introgressor across each haplotype. SARGE reports each branch length as a percent of the total height of the tree both above and below that branch (fig. S7), which in our dataset includes all fixed differences between the genomes in our dataset and the reference chimpanzee genome. The units in which these TMRCAs are expressed are therefore a percent of two times the total divergence time between humans and chimpanzees. These values were then corrected for branch shortening, according to the mean branch shortening or “missing evolution” values published in a prior study (1), converted to branch units by dividing each number by 26 Ma. To correct for branch shortening, we added the amount of missing evolution reported for a given archaic genome (in the same units as ARG branch lengths) to the archaic genome’s branch when computing TMRCAs. That is, if the TMRCA between a modern and archaic haplotype is x and the branch shortening value for the archaic haplotype is y, then the corrected TMRCA between them is (2x + y)/2.
Our ascertainment strategy allowed some candidate admixed haplotypes to intersect. If a human haplotype was inferred to have Neanderthal ancestry at one site and Denisovan ancestry at the next variable site, for instance, then it is likely that the two haplotypes actually originated from the same source. Because of this possibility, we merged all these haplotypes together, averaging the TMRCA to admixer in each, weighting by the relative lengths of the two haplotypes being merged. We then repeated this process until each haplotype was unable to merge with any others. Because each such haplotype resulted from the combination of haplotypes with different types of ancestry, all merged haplotypes were labeled as ambiguous, rather than Neanderthal or Denisovan, origin.
At this stage, the set of haplotypes likely still contained haplotypes resulting from ILS rather than admixture. To help mitigate this, we assigned each a score designed to be high in cases of admixture and low in cases of ILS. We chose a date that predates the human/archaic hominin separation, 700 ka ago, and computed the P value of each haplotype having originated at that time or earlier according to its length and according to its TMRCA to the candidate admixer. For this, we assumed both TMRCAs to admixer and haplotype lengths to be exponentially distributed, and we assumed neutral evolution, a standard recombination rate of 1 cM/Mb, a 25-year generation time, and 13 Ma ago human-chimpanzee divergence. We assigned each haplotype a probability of resulting from ILS, based on its TMRCA: If the TMRCA (as a percent of the height of the tree) is y, then
pTMRCA=1−e−(26e6700,000)(y)
. We then assigned each a probability of resulting from ILS, based on its length: If x is the length of a haplotype, in bases, then
plen=e−700,0001e8*25x
. We then computed a score, using a pseudo-count of 0.001 to avoid taking the logarithm of 0: Sadm = − (log10(pTMRCA + 0.001) + log10(plen + 0.001)).
Because our prior filtering strategies already removed many ILS haplotypes, we sought to find the smallest threshold for Sadm that gave reasonable results. We therefore tested Sadm cutoffs at every fifth percentile of the distribution across all haplotypes and computed the coefficient of variation (SD divided by mean) for TMRCAs to admixer in each class of archaic-introgressed haplotypes (Neanderthal, Denisovan, and ambiguous) within each human population defined within the SGDP (14). Because we expect members of these populations to have somewhat shared histories, we expected the coefficient of variation to the admixer to decrease and level out as an appropriate cutoff was reached, reflecting the removal of highly variable segments with old TMRCAs (ILS). We found such a cutoff at the 30th percentile of the score distribution and excluded haplotypes with scores below this threshold (fig. S24). Because our resulting archaic introgression maps still underestimated archaic ancestry per genome relative to the D statistic (Fig. 3A) and because our real dataset overestimated the extent of ILS relative to every demographic simulation we ran and underestimated admixture relative to the size of inferred deserts (Fig. 4), we believe that this cutoff was reasonable, if not overly conservative.
We also quantified uncertainty in our percent admixture estimates using the weighted block jackknife technique (18) with 10-Mb blocks. We generated windows using BEDTools, omitted each from our admixture maps in turn, and recalculated the percent of each type of archaic ancestry in each SGDP genome from our admixture maps. We then used this distribution of archaic ancestry estimates for each individual to obtain a 95% CI. Mean percent archaic ancestry, along with the minimum lower and maximum upper bound of the 95% CI for each type of ancestry across all genomes in each population are given in table S2.
Because our method relies on phased data, improper phasing could pose problems for this by breaking haplotypes where they should not be broken. Improper phasing is most likely to be a problem in the archaic genomes, for which reads were short and there is no phasing reference panel, so many sites were phased randomly, after phasing the others using a (likely inadequate) modern human reference panel (see “Data processing” section above). We worked around this issue by only conducting admixture scans on modern human genomes, those more likely to be properly phased, and by tracking only whether each candidate admixed clade contained Neanderthal or Denisovan haplotypes, without regard to which specific Neanderthal or Denisovan haplotypes they contained. That is, a clade containing one modern human genome haplotype and one Neanderthal haplotype would still be considered the same clade (potentially from the same admixture event) if at the next site the Neanderthal haplotype contained within was replaced by another. To ensure that this did not negatively affect our results, we repeated some admixture scans on simulated data after intentionally introducing phasing errors into the archaic genomes; we did not see evidence that this negatively affected the results (see Supplementary Text).
We often dismiss our extinct cousins as brutish cave dwellers — and the word Neanderthal is thrown about as a dig at people who have outdated ways of thinking.
Nice try, but not quite. We are learning Neanderthals were just as innovative and sophisticated as we fancy ourselves to be — raising questions about what it means to be human.
It’s me, Katie Hunt, filling in for Ashley Strickland, in this edition of Wonder Theory.
A tiny, engraved bone is changing how we think about Neanderthals, the heavily built Stone Age hominins who disappeared about 40,000 years ago.
Found in Einhornhöhle (or Unicorn) cave in northern Germany, the decorated deer phalanx, or toe bone, features a geometric pattern. Researchers have said it’s the most definitive evidence yet that Neanderthals were capable of artistic expression — a sign of what archaeologists call complex behavior,once thought unique to Homo sapiens.
What’s less clear is how Homo neanderthalensis learned these skills. The possibility that Neanderthals were just as cognitively advanced as Homo sapiens also may have implicationsfor why they died out.
Other worlds
The aurora borealis, or northern lights, are Earth’s greatest light show, dazzling those lucky enough to see them in the northernmost reaches of our planet.
It’s a phenomenon shared by other planets in our solar system, including the largest, Jupiter, which is bathed in spectacular color at its poles.
Characterized by massive pulsating X-ray flares, Jupiter’s northern lights were first discovered 40 years ago. Astronomers have long sought to explain the mechanism behind these auroras.
Now, an international team of scientists has announced they have solved what NASA has called “a powerful mystery.”
Consequences
Plastic waste is a visible way humans contaminate rivers and oceans, but less noticeable forms of pollution can be just as perilous for aquatic life.
Traces of illegal drugs —via sewage systems — can infiltrate waterways in urban areas. Researchers in the Czech Republic have investigated whether illicit drugs at levels found in bodies of freshwater alter fish behavior.
In the study, the scientists found brown trout living in a tank of water containing methamphetamine for a period of eight weeks sought out water containing the drug — when given a choice — for four days after being transferred to meth-free water.
This behavior suggested the fish were experiencing withdrawal because they sought out the drug when it became available, according to researchers.
Defying gravity
A spacewalk is the most dangerous job in space. Imagine trying to focus on a memorized set of tasks while stepping out of an airlock and wearing a 300-pound spacesuit — with the glow of planet Earth and the sun and the dark void of the universe all around you.
Two Chinese astronauts have completed the country’s second-ever spacewalk and the first from the core module of China’s new space station. The missionmarked a huge achievement for the country, which has been excluded from the International Space Station.
Back on Earth, though, a violent attack on two Chinese space scientists has drawn the wrong kind of attention to China’s celestial ambitions.
Sign up for Meanwhile in China, CNN’s three-times-a-week newsletter on the latest news you need to know about China’s rise and analysis on what it means for the world.
Climate changed
Scientists have pored over more than 300 fossils belonging to different members of the Homo genus, or the human family tree — including us, Homo sapiens — and reconstructed the Earth’s climate to see what conditions were like when these different species of human lived.
The researchers found that climate — particularly temperature — has been the main driver of changes in body size for the past million years.
Colder, harsher climates were linked to larger bodies, such as those of well-built Homo neanderthalensis, while warmer climates were linked to smaller bodies, the scientists found.
For now, the team said, it’s unlikely that the current, human-induced climate crisis will dramatically impact our body sizes.
The wonder
Here are some more mind-blowing reads.
— Holy cow! Scientists in Austria may have found an unlikely solution to the problem of plastic pollution.
— Check out eight pivotal moments from NASA’s Space Shuttle Program.
— Virgin Group founder Richard Branson will take a rocket-powered space plane to the edge of space this weekend. If all goes according to plan, Branson will be the first billionaire to travel to space on a vehicle he helped fund, beating fellow space baron Jeff Bezos by nine days.
— In fossilized dinosaur poop, researchers have found a creature unknown to science. And it was preserved in three dimensions.
Like what you’ve read? Oh, but there’s more. Sign up here to receive in your inbox the next edition of Wonder Theory, brought to you by CNN Space and Science writer Ashley Strickland, who finds wonder in planets beyond our solar system and discoveries from the ancient world.
The Neanderthal bone carving. Image: V. Minkus/NLD
Patterns deliberately etched onto a bone belonging to a giant deer is further evidence that Neanderthals possessed the capacity for symbolic thought.
Neanderthals decorated themselves with feathers, drew cave paintings, and created jewelry from eagle talons, so it comes as little surprise to learn that Neanderthals also engraved patterns onto bone. The discovery of this 55,000-year-old bone carving, as described in Nature Ecology & Evolution, is further evidence of sophisticated behaviour among Neanderthals.
“Evidence of artistic decorations would suggest production or modification of objects for symbolic reasons beyond mere functionality, adding a new dimension to the complex cognitive capability of Neanderthals,” as Silvia Bello, an archaeologist at the Natural History Museum in London, explained in an associated New & Views article.
The carving was found at the Einhornhöhle archaeological site in the Harz mountains of northern Germany, and it features a line pattern consisting of six etchings that form five stacked chevrons. The “parallel and regularly spaced engravings have comparable dimensions and were very probably created in a uniform approach suggesting an intentional act,” according to the study, led by archaeologist Dirk Leder from the State Service for Cultural Heritage Lower Saxony in Hannover, Germany.
Greyscale images made from micro-CT scans of the relic. A total of 10 etchings were found on the bone, six of which (shown in red) were used to create the chevron pattern.Image: NLD
G/O Media may get a commission
Radiocarbon dating places the 2.2-inch-long toe bone to the Middle Paleolithic, and shortly before the arrival of Homo sapiens to the region. Microscopic analysis of the fossil suggests it was boiled prior to etching, which was likely done to soften the bone prior to carving, according to the research. The markings don’t resemble cuts typically associated with butchering, and the decorated item is of “no practical use,” as the researchers write in the study. The carving likely held significant symbolic meaning given the rarity of giant deer north of the alps during this time period. The exact meaning of the patterns, however, is anyone’s guess.
That the bone carving was produced by Neanderthals is not a certainty. Genetic evidence presented earlier this year places the arrival of anatomically modern humans to central Europe at around 45,000 year ago, which post-dates the carving by around 6,000 years. This apparent temporal gap points to the artifact as belonging to Neanderthals, but it’s not entirely implausible to suggest that Homo sapiens produced, or possibly influenced, the creation of this artwork.
Bello, who was not involved in the new study, said “we cannot exclude a similarly early exchange of knowledge between modern human and Neanderthal populations, which may have influenced the production of the engraved artefact from Einhornhöhle.” This possibility, that Neanderthals learned this skill from modern humans, doesn’t diminish their cognitive capacities, however.
“On the contrary, the capacity to learn, integrate innovation into one’s own culture and adapt to new technologies and abstract concepts should be recognized as an element of behavioural complexity,” wrote Bello. “In this context, the engraved bone from Einhornhöhle brings Neanderthal behaviour even closer to the modern behaviour of Homo sapiens.”
Of course, it’s also possible that the authors of the new study are completely right—that Neanderthals were indeed responsible for the bone carving, and that modern humans had nothing to do with it. Neanderthals, in addition to their aforementioned cultural contributions, engaged in many other sophisticated behaviors, such as caring for disabled loved ones, burying their dead, and taking care of their teeth. That Neanderthals carved patterns onto bone is thus hardly a stretch.
Texas Gov. Greg Abbott on Thursday criticized President Joe Biden for calling his decisions to lift Covid-19 restrictions and mask mandates earlier this week “Neanderthal thinking” and blamed the state’s ongoing outbreak on undocumented immigrants.
Abbott’s comments come after his widely criticized decision on Tuesday to rescind most of the state’s Covid-19 restrictions, including a statewide mask mandate. Texas businesses will be allowed to open “100%,” effective March 10, he said. Mississippi Gov. Tate Reeves made a similar move at roughly the same time.
Biden on Wednesday slammed the governors for what he said was a “big mistake” and added that “the last thing we need is Neanderthal thinking.”
Abbott told CNBC’s “Squawk Box” that the comment was “not the type of word that a president should be using” and blamed the spread of the coronavirus on immigrants crossing the southern border. The Republican governor said the Biden administration has “refused to test” them for the virus.
“The Biden administration has been releasing immigrants in South Texas that have been exposing Texans to Covid. Some of those people have been put on buses, taking that Covid to other states in the United States,” Abbott told CNBC. “That is Neanderthal-type approach to dealing with the Covid situation.”
While the Republican governor didn’t provide specifics, Telemundo reported on Tuesday that some migrants released by Border Patrol in the Texas city of Brownsville subsequently tested positive for Covid-19. Since the city began testing on Jan. 25, 108 migrants have tested positive for Covid-19, which is 6.3% of all those who took a test, according to the report.
“The Biden administration must stop importing Covid into our country,” Abbott said.
Top U.S. health officials have repeatedly urged states not to lift Covid-19 restrictions as nationwide coronavirus cases and deaths stall and highly transmissible variants threaten to “hijack” the recent decline in infections.
However, Abbott defended his decision to lift the state’s mask requirements, claiming that Texans already know that “the safe standard, among other things, is to wear a mask.”
“Do they really need the state to tell them what they already know for their own personal behavior?” Abbott told CNBC.
The governor added that the state’s coronavirus infections are “at four-month lows” and Texas hospitals stand ready to treat an influx of patients if needed. Texas is reporting a daily average of roughly 7,265 new cases over the last week, a drop compared with the peak of more than 20,400 daily cases the state reported in January, according to a CNBC analysis of data compiled by Johns Hopkins University.
However, new infections have started to creep back up across the state, with average daily new cases growing by nearly 13% compared with a week ago.
Abbott said most of the state’s coronavirus spread over the holiday was driven by indoor gatherings, not by restaurants and other businesses. The newly lifted restrictions “are not really that transformative” because the state’s mask mandate wasn’t enforced and businesses were already at 75% capacity, he said.
“Maybe to people in New York it seems like this is a big difference,” Abbott said.
The research found that by the end of 2020, global coronavirus death tolls were more than 10 times higher in nations where over half the adults are overweight, compared to those where fewer than half are overweight.
Using mortality data from Johns Hopkins University (JHU) and the World Health Organization (WHO), the team discovered that of 2.5 million Covid-19 deaths reported by the end of February, 2.2 million were in countries where more than half the population is overweight. Mortality rates also increased along with countries’ prevalence of obesity. The researchers also noted that the link persisted even after adjusting for age and national wealth.
The findings follow hundreds of worldwide studies, which also confirmed the increased need for medical care for Covid-19 patients who are overweight, the report notes. A study in China found overweight people had 84% increased odds for developing a severe form of the disease. Another US study found obese people were more than twice as likely to need hospitalization and more than six times as likely to die, or need mechanically assisted breathing, after developing Covid-19.
The authors of the World Obesity Forum report have called for people living with obesity to be prioritized for coronavirus testing and vaccination. “Covid-19 is not the first respiratory viral infection exacerbated by overweight. Data from the last two decades on the impact of MERS, H1N1 influenza and other influenza-related infections show worse outcomes linked to excess bodyweight,” the study added. “An overweight population is an unhealthy population, and a pandemic waiting to happen.”
YOU ASKED. WE ANSWERED
Q: How many cases caused by Covid-19 variants are there in the US?
A: At least 2,581 cases of coronavirus variants first spotted in the UK, South Africa and Brazil have been reported in the US, according to data updated Tuesday by the US Centers for Disease Control and Prevention (CDC).
The vast majority of these infections, 2,506, are caused by the more contagious strain known as B.1.1.7, which was originally detected in the UK. In addition, 65 cases have been reported of a variant initially seen in South Africa, called B.1.351. Lastly, 10 cases of the P.1 variant first found in Brazil have been discovered in five states.
Send your questions here. Are you a health care worker fighting Covid-19? Message us on WhatsApp about the challenges you’re facing: +1 347-322-0415.
WHAT’S IMPORTANT TODAY
‘Neanderthal thinking.’ Biden slams Texas and Mississippi for lifting restrictions
US President Joe Biden sharply criticized states such as Texas and Mississippi for lifting Covid-19 restrictions and mask mandates against pleas from the CDC and other top public health officials, accusing those in power of “Neanderthal thinking.
“I think it’s a big mistake. Look, I hope everybody’s realized by now, these masks make a difference. We are on the cusp of being able to fundamentally change the nature of this disease because of the way in which we’re able to get vaccines in people’s arms,” Biden said when asked about the decisions by the Republican governors of Texas and Mississippi to relax restrictions.
Russian vaccine expands its reach in Latin America while Cuba goes its own way
Russia’s Sputnik V shot has seen rising popularity across Latin America as more countries announce shipments and deals to purchase the Covid-19 vaccine. Nine Latin American countries have approved its use. The shot is cheaper and can be stored at higher temperatures than the Pfizer vaccine, which has made it appealing to Latin American countries with less-developed economies and infrastructures.
Meanwhile, Cuba is making its own vaccines. Starting in March, two of the island’s four homegrown vaccine candidates will begin their third and final trials, the Cuban government has announced. For much of 2020, Cuba was able to keep the spread of the pandemic under control but a bungled reopening to international travelers in December led to a surge in cases.
Spanish princesses’ vaccinations abroad spark controversy at home
Two Spanish princesses, who got vaccinated against Covid-19 in the United Arab Emirates much earlier than they would have back in Spain, have sparked outrage for skipping the vaccine line. Several Spanish ministers on Wednesday publicly criticized the two princesses, Elena and Cristina, who were inoculated while visiting their father, Spain’s former King Juan Carlos, in Abu Dhabi, where he’s living.
In response to media reports about the vaccination, Princess Elena said in a statement they took the shot with the aim of a getting a health passport so that they could visit their father regularly. A royal household spokesman noted that while they are sisters of Spain’s King Felipe, the princesses have not had any official duties as members of the royal family since at least 2014.
ON OUR RADAR
As Covid-19 cases continue to slide, California may soon allow fans to attend Major League Baseball games.
While vaccines will be available for all US adults by the end of May, teenagers will still have to wait until the fall, Dr. Anthony Fauci says.
The B.1.1.7 coronavirus variant first seen in the UK is more contagious than older circulating versions of the virus and it’s likely to drive a large new surge of infections, research suggests.
A global fake Covid-19 vaccine distribution network has been dismantled in South Africa and China.
The US is still holding firm to the strategy of administering two doses of the Moderna and Pfizer/BioNTech Covid-19 vaccines a few weeks apart.
TOP TIP
Rock and Roll Hall of Famer John Oates and his wife Aimee are reviving the Oates Song Fest 7908 to fundraise for Feeding America, the nation’s largest hunger-relief organization.
The economic fallout of the Covid-19 pandemic is driving up food insecurity across the US. Feeding America estimates that one in six Americans could face food insecurity as a result of the pandemic.
The virtual star-studded fundraiser will stream on Nugs.tv on March 20 at 8 p.m. ET. Oates and YouTube sensation Saxsquatch will host the event. Find out more here.
TODAY’S PODCAST
“The reality is that when you’re out of sight, you’re really out of mind. And a lot of remote workers feel like they miss out on a lot of these opportunities because they’re not getting access to the projects and opportunities that would help get them promoted.” — Andrew Hewitt, senior analyst at Forrester
The coronavirus has fundamentally changed the American workplace, but which changes can we expect to stick around permanently? Hewitt, a remote work expert, shares his predictions for the post-pandemic future of office work. Listen now.
Earth’s magnetic poles flipped 42,000 years ago, which may have triggered a global climate crisis, a new study found.
The resulting changes in temperatures and radiation levels may have killed off many large mammals.
The event may have ultimately contributed to the extinction of Neanderthals.
Visit the Business section of Insider for more stories.
Earth saw a lot of commotion when its magnetic poles flipped 42,000 years ago.
Scientists have known about the flip since the late 1960s. Earth’s magnetic poles aren’t static — they’re generated by electric currents from the planet’s liquid outer core, which is constantly in motion. As of late, Earth’s magnetic North pole has wandered considerably on a path toward northern Russia.
But for the most part, scientists didn’t think the last pole flip had a major environmental impact. Sure, the planet’s magnetic field got weaker, allowing more cosmic rays to penetrate the atmosphere, but plant and animal life wasn’t known to have been greatly affected.
A new study now suggests a more dramatic phenomenon occurred: The additional cosmic rays may have depleted ozone concentrations, opening the floodgates for more ultraviolet radiation in the atmosphere. Shifting weather patterns may have expanded the ice sheet over North America and dried out Australia, prompting the extinction of many large mammal species. A solar storm, meanwhile, might have driven ancient humans to seek shelter in caves.
As competition for resources grew, our closest extinct human relative, Neanderthals, may have died out.
“It would have been an incredibly scary time, almost like the end of days,” Chris Turney, an Earth scientist at the University of New South Wales, said in a video describing the new research.
Scientists have not come to agree on a definitive theory about why Neanderthals disappeared. Some research suggests their extinction happened naturally, as Neanderthals inbred with modern humans or the population became too small to hunt, mate, and raise children. Other scientists have posited that Neanderthals may have been out-competed for resources as modern humans started to populate Europe.
But it’s probably no coincidence that Neanderthals died out following a major shift of Earth’s magnetic poles, Turney’s study suggests.
“It was only when you started talking between different areas of science, you could see the connections,” his co-author, Alan Cooper, said. “Before that, none of the different fields had worked out 42 [42,000 years ago] was the key event.”
Ancient trees and caves hold clues about a possible climate disaster
A scientist takes measurements in the Bruniquel Cave in southwestern France.
Thomson Reuters
To find out what happened to Earth’s climate 42,000 years ago, scientists asked a native New Zealander who was alive at the time: the ancient kauri tree. The tree’s rings serve as a record of radiocarbon levels — a radioactive isotope — in the atmosphere over tens of thousands of years. Indeed, the rings showed evidence of rising radiocarbon at the time when the magnetic fields flipped, an event known as the “Laschamps excursion.”
The event isn’t unique in the history of our planet: The British Geological Survey estimates that four or five pole flips occur every million years.
During these reversals, the magnetic shield that protects our planet from solar wind (charged particles streaming off the sun) gets weaker. Earth’s magnetic North and South poles — not to be confused with the planet’s northernmost and southernmost geographic points — switch places.
The Laschamps excursion, the most recent example of this magnetic flip, likely took place over a period of 1,000 years. That’s a blip in Earth’s lifetime, but long enough to alter the fates of those living on the planet.
“In that process of flipping from North to South and South to North, effectively the Earth’s magnetic field almost disappeared,” Turney said. “And it opened the planet up to all these high-energy particles from outer space.”
If the sun spewed extra-high levels of radiation in a solar storm during that time, Neanderthals may have needed to seek cover.
Indeed, the Laschamps excursion coincided with a rise in cave use across Europe and Southeast Asia. In particular, researchers have found red ocher handprints in the regions’ caves that date back some 40,000 years. According to the new study, this pigment could have served as an ancient form of sunscreen.
Red ocher handprints in Spain’s El Castillo cave may represent the use of an ancient form of sunscreen.
Paul Pettitt, Gobierno de Cantabria
Another magnetic reversal could be ‘imminent’
Not all researchers are convinced by Turney and Cooper’s analysis. Chris Stringer, an anthropologist at the Natural History Museum in London, told The Guardian that although the Laschamps excursion could have contributed to Neanderthals’ demise, it’s hard to know exactly when they died out.
“They did survive longer and ranged more widely than just Europe, and we have a very poor fix on the timing of their final disappearance across swathes of Asia,” Stringer said.
James Channell, a geologist at the University of Florida, told NPR that historical records of ice cores dating back 42,000 years don’t indicate a global climate crisis. Still, he added, “there does appear to be a linkage” between the extinction of large mammals and the weakening of Earth’s magnetic field.
At the very least, the new study offers a hint about what could happen if magnetic north and south flip again.
Scientists know that Earth’s magnetic field has weakened about 9% in the past 170 years. The magnetic North pole has also been drifting more rapidly since the 1990s, at a rate of 30 to 40 miles per year.
This has “increased speculation that a field reversal may be imminent,” the researchers wrote. Such an event could potentially topple power grids and satellite networks. An increase in radiation could also expose more people to diseases like cancer.
But scientists suspect that any possible magnetic reversal would be in its early stages. Earth’s magnetic field is still far stronger than it was the last time the poles flipped.