A new Call of Duty: Warzone map is rumored for Season 3. However, this time next year we may have another new map, and it may be World War 2 themed. Taking to Twitter, prominent industry insider and leaker, Tom Henderson — the source behind many accurate reports and leaks pertaining to Black Ops Cold War, Warzone, Modern Warfare, and other COD titles — recently claimed that there will be another new Warzone map next year, which conflicts what other insiders and reports have been claiming.
According to Henderson, Warzone will get some type of WW2 experience, though it may not be an entirely new map, but something more akin to Rebirth Island. Unfortunately, details on the map are scarce, but Henderson seems very confident in the information.
“There will be a new Warzone map of some kind in 2022,” said Henderson. “It might not be a full-fledged map, but we should be getting a WW2 experience in Warzone. Possibly a Rebirth Island type map. This goes against all the current bits of info flying around, but I’m confident in that.”
Adding to this, Henderson seemingly hints that Sledgehammer Games will not be the developer of the map, which would, in turn, suggest Raven Software will make it as they are the primary Call of Duty: Warzone developer.
There will be a new Warzone map of some kind in 2022. It might not be a full-fledged map, but we should be getting a WW2 experience in Warzone. Possibly a Rebirth Island type map 🙂
This goes against all the current bits of info flying around, but I’m confident in that.
— Tom Henderson (@_Tom_Henderson_) March 27, 2021
For now, take all of this information with a grain of salt. While the source is reputable and reliable, everything here is unofficial, subject to change, and conflicts with some previous reports and rumors. That said, if Henderson provides any more information or if Activision provides any type of comment, we will be sure to update the article accordingly.
Call of Duty: Warzone is available, for free, via the PS4, PS5, Xbox One, Xbox Series X, Xbox Series S, and PC. For more coverage on Warzone, Call of Duty 2021, Black Ops Cold War, Modern Warfare, and everything else COD, click here.
Scientists are mapping the mysterious “lost” continent of Zealandia — which was discovered in 2017 — for the first time. The gigantic landmass in the South Pacific disappeared beneath the waves 23 million years ago.
It was originally part of the gigantic super-continent Gondwana, which was made up of continents which now exist in the southern hemisphere.
Covering 1.9 million square miles, Zealandia is six times larger than than Madagascar, the next-largest continental fragment.
It extends from south of New Zealand northward to New Caledonia and west to the Kenn Plateau off Australia’s east coast.
About 94 per cent of the landmass is underwater.
The “hidden” continent is now being partially mapped thanks to a deepwater mapping expedition led by The University of Queensland, The Sun reported.
Chief scientist Dr Derya Gürer spent 28 days at sea on Schmidt Ocean Institute’s research vessel Falkor, exploring the north-western edge of the continent.
“We’re only just starting to discover Zealandia’s secrets,” Dr Gürer said. “It’s remained hidden in plain sight until recently and is notoriously difficult to study.”
Radar scans carried out by the team explored the contours of the narrow connection between the Tasman and Coral Seas in the Cato Trough region – the narrow corridor between Australia and Zealandia.
In total, they have provided 14,00 square miles of topographical data to the Seabed 2030 project.
The project aims to produce a publicly available bathymetric map to measure the depth of the world’s ocean floor depth by 2030.
Read more: Scientists discover new continent named ‘Zealandia’
“The seafloor is full of clues for understanding the complex geologic history of both the Australian and Zealandian continental plates,” Dr Gürer said.
“This data will also improve our understanding of the complex structure of the crust between the Australian and Zealandian plates. It’s thought to include several small continental fragments, or microcontinents, that were split from Australia and the supercontinent Gondwana in the past.”
Zealandia is thought to have broken off from Gondwana between 85 and 79 million years ago.
The supercontinent encompassed what is today South America, Africa, Antarctica, Australia, Zealandia, Arabia and the Indian subcontinent.
By about 23 million years ago, it’s thought that Zealandia was almost completely submerged in water.
Experts spent 20 years gathering data to make the case for the submerged landmass being a continent. Their efforts were frustrated because most of it is hidden beneath the waves.
Is Fortnite Season 6 bringing back the classic map? A number of recent leaks and observations suggest that the popular battle royale video game may return to the pre-Chapter 2 map at some point soon. In general, there have been plenty of theories and speculation over the last several months suggesting this is exactly what Epic Games is working towards. Whether any of these theories or speculation have any merit remains to be seen, but they are bolstered by the occasional rumor or leak in the same sort of direction and plenty of fans have been hankering to return to an older form of the map for quite some time.
Since Season 6 launched this month, dataminers have discovered two things added to the files of the game: dinosaurs and meteors. The fact that dinosaurs and meteors are popping up in the files at the same time certainly seems to suggest some type of extinction event, though sometimes leaks make events sound more exciting than they end up being.
Many theories making the rounds within the Fortnite community theorize that dinosaurs will be added to the map, and then wiped out with some type of asteroid event. That said, while the leaks point to this as a possibility, they haven’t confirmed anything.
Of course, if there is some type of extinction/asteroid event, it’s reasonable to think it could result in the destruction of the current map, which paves the way for a new map. Adding to this, the recent cinematic trailer for Season 6 features a pre-Chapter 2 location, Happy Hamlet, which debuted back in Season 7 as a Flush Factory replacement.
Now, there’s nothing in the trailer that confirms it’s Happy Helmet, but it’s unclear what else it could be. That said, it’s unclear why Happy Hamlet would be in the trailer, unless you were teasing a pre-Chapter 2 map. The only explanation is that the map in the trailer is purely for cinematic purposes and thus everything about is it irrelevant, which is surely possible, but not nearly as exciting.
For now, all we have is speculation. That said, feel free to leave a comment or two letting us know what you think or, alternatively, hit me up on Twitter @Tyler_Fischer_ and let me know over there. Is there anything to this theory? Would you like to see Fortnite return to a pre-Chapter 2 map or even the original map?
Rebirth Island’s new Resurgence Extreme mode is available right away with the launch of Season 2. This is essentially the current Resurgence mode but on steroids, increasing the player count up to 90!
“The high-octane, respawn-enabled Resurgence mode on Rebirth Island will be taken to the extreme during Season Two, upping the max player count in the limited-time Rebirth Island Resurgence Extreme mode. Up to 90 players can drop onto Rebirth Island for an incredibly frenetic fight for supremacy, as they look to eliminate every last member of enemy squads to prevent them from getting a second, third, or even forth chance at revenge.
Just like Resurgence, squad members can spawn back in if their Rebirth Countdown hits zero and at least one of their allies is still alive, and specific Caches around the map will refresh their items frequently to ensure there is no shortage of firepower around the island.”
Exfiltration
Activision
Warzone Season 2’s new Exfiltration mode will be played on Verdansk.
Exfiltration is a new mode that is played on Verdansk. It will be added in-season, meaning it won’t be available at the start of Season 2.
“It’s about time that the exfil chopper arrives before the Circle Collapse fully closes in. During an Exfiltration Battle Royale, a portable radio crackles into life, coming online somewhere in Verdansk. The Operator who secures this radio and holds onto it for a sufficient period of time automatically wins the game for them (or their squad, in non-Solo modes). To ensure their exfil isn’t by the book, anyone holding the radio is marked on the Tac Map as if they were under a Most Wanted Contract (also known as an HVT or High Value Target) with all Operators also receiving intel on how much longer the current radio holder has until they win. Other than this new win condition, the same Battle Royale rules apply. Expect a circle collapse and a winner to be determined by last Operator or squad standing, should nobody receive an early exfil with the radio.”
Most of the world maps you’ve seen in your life are past their prime. The Mercator was devised by a Flemish cartographer in 1569. The Winkel Tripel, the map style favored by National Geographic, dates to 1921. And the Dymaxion map, hyped by the architect Buckminster Fuller, debuted in a 1943 issue of Life.
Enter a brash new world map vying for global domination. Like sports, the mapmaking game can sometimes grow stale when top competitors are stuck on the same old strategy, said J. Richard Gott, an astrophysicist at Princeton who had previously mapped the entire universe. But then along comes an innovator: Think Stephen Curry of the Golden State Warriors, splashing 3-pointers from areas of the court the rest of basketball hadn’t thought were worth guarding.
“We were sort of reaching the limit of what you could do,” Dr. Gott said. “If you wanted any significant breakthrough, you had to use a new idea.”
Dr. Gott’s version of Steph Curry’s wait-you-could-shoot-from-there 3? Use the back of the page, too. Make the world map a double-sided circle, like a vinyl record. You could put the Northern Hemisphere on the top side, and the Southern Hemisphere on the bottom, or vice versa. Or to put it differently: You could deflate the 3-D Earth into two dimensions. And if you did, you could blow the accuracy of previous maps out of the water.
No flat map of our round world can be perfect, of course. First you need to peel off Earth’s skin, then pin it down. This mathematical taxidermy introduces distortions. If you have a Mercator projection on your classroom walls, for example, you may grow up thinking Greenland is the size of Africa (not even close) or Alaska looms larger than Mexico (also nope). This warped worldview might even bias you, subconsciously, to under-appraise most of the developing world.
Shapes also change in map projections. Distances vary. Straight lines curve. Some projections, such as Mercator, aim to excel at one of these concerns, which aggravates other errors. Other maps compromise, like the Winkel Tripel, so named because it tries to strike a balance between three kinds of distortion.
Starting in 2006, Dr. Gott and David Goldberg, a cosmologist at Drexel University in Philadelphia, developed a scoring system that could sum up these different kinds of error. The Winkel Tripel beat out other major contenders. But one big source of distortion persisted: a mathematical incision, often running from pole to pole down the Pacific. The resulting shape can never again be stretched and pulled back into the unbroken surface of a sphere. “This does violence to the globe,” Dr. Gott said.
His new kind of double-sided map, crafted with Dr. Goldberg and Robert Vanderbei, a mathematician at Princeton, skips the topological violence entirely. The map simply continues over the edge. You could stretch a string over the side; an ant could walk there. Without any cut, the map’s Goldberg-Gott distortion score blows all other maps currently in use out of the water, the team reports in a draft study.
Cartographers who regularly study world maps — perhaps fewer than 10 people — will now have time to react. “It never came up to me that it could be done in this way,” said Krisztián Kerkovits, a Hungarian cartographer working to develop his own projections.
But while the new map excels at addressing distortion, Dr. Kerkovits said it also introduced a new weakness. You can see only half of the planet at once, unlike the Winkel Tripel and Mercator. That undermines the basic premise of flaying out the whole world for inspection on a single page or screen.
To Dr. Gott, this is no different than the 3-D globe itself. But Dr. Kerkovits isn’t quite sure: After all, you can always rotate a globe slightly to see the neighbors of any chosen point. But in the double-sided map, you might have to flip the entire thing.
Ultimately a map’s success depends on which applications it’s used for, and how its popularity grows over time. Dr. Gott, whose paper also presents double-sided projections of Jupiter and other worlds, envisions the new map style as a physical object to turn over in your hands.
You could cut one out of a magazine, or you could store a whole stack of them in a thin sleeve, showing different planets or different data layers. And he hopes you may be tempted to try to print out and make your own using the appendix of his paper.
“Glue it back to back with double-stick tape — I think that’s better than Elmer’s Glue, but you can use glue,” Dr. Gott said. Then cut it out. “Maybe use card stock paper,” he added.
A colorful collage of binary star pairs near Earth, courtesy of the Gaia survey. Credit: ESA/Gaia/DPAC
The latest star data from the Gaia space observatory has for the first time allowed astronomers to generate a massive 3-D atlas of widely separated binary stars within about 3,000 light years of Earth—1.3 million of them.
The one-of-a-kind atlas, created by Kareem El-Badry, an astrophysics Ph.D. student from the University of California, Berkeley, should be a boon for those who study binary stars—which make up at least half of all sunlike stars—and white dwarfs, exoplanets and stellar evolution, in general. Before Gaia, the last compilation of nearby binary stars, assembled using data from the now-defunct Hipparcos satellite, included about 200 likely pairs.
“This is just a massive increase in sample size,” said El-Badry. “And it is an increase in what kinds of evolutionary phases we find the binaries in. In our sample, we have 17,000 white dwarfs alone. This is a much bigger census.”
White dwarfs are the end stages of most stars; the sun will likely end up as a compact white dwarf in 5 billion years. El-Badry’s atlas includes 1,400 systems that consist of two white dwarfs and 16,000 binaries that consist of a white dwarf and another type of star
The vast majority of the 2.6 million individual stars are still in the prime of life, however. Astronomers refer to them as main sequence stars, because they cluster along a line when plotted on a graph showing temperature versus brightness.
With such a large sample size, El-Badry said, it’s possible to do population demographics of these stellar twins, asking questions such as: What is the distribution of mass ratios of the two stars in all these binary systems? How are their separations or eccentricities distributed?
El-Badry plans to focus in the future on the white dwarf binaries, because white dwarfs can be assigned an age more precisely than is possible with regular stars. Main sequence stars like the sun can look the same for billions, or even tens of billions, of years, while white dwarfs change—for one thing, they cool down at a well-defined rate. And since binary pairs are birthed at the same time, the age of the white dwarf tells astronomers the age of its main-sequence twin, or of any planets around the stars.
“For a white dwarf, in general, it is easy to tell how old it is—not just how old since it became a white dwarf, but what its total age is,” he said. “You can also measure their masses, because white dwarfs have a well-understood mass-radius relation.”
As an example, El-Badry and colleagues recently used the Gaia data to estimate the age of a Jupiter-sized gas giant discovered by the TESS satellite around a white dwarf-K dwarf pair. That exoplanet, TOI-1259Ab, turned out to be about 4 billion years old, based on the age of the white dwarf.
When stars are plotted according to their color and brightness, they fall along a line called the main sequence, where they spend most of their lives, evolving into red giants and then white dwarfs only at the end of their lives. The previous survey of nearby binary stars found several hundred, whereas the newest atlas contains 1.3 million pairs, allowing astronomers to better understand the evolution of binary stars and stars in general. Credit: Kareem El-Badry, UC Berkeley
“In this catalog, there are something like 15 systems like this: star plus planet plus white dwarf,” he said, “and there are another few hundred that are star plus planet plus another star. Those are also potentially interesting because, in some cases, the other star will do something dynamically to the planet.”
The new catalog of nearby binary stars has been accepted for publication in the journal Monthly Notices of the Royal Astronomical Society.
El-Badry also collaborated with Jackie Faherty, a scientist and educator at the American Museum of Natural History in New York City, to create a video fly-through of all the million binary stars around Earth, which represents a good chunk of the entire Milky Way Galaxy.
Binary stars
Until Gaia was launched by the European Space Agency in 2013 to precisely measure the distances and motions of millions of nearby stars, the only way to find binaries was to look for stars close together in the sky. This can be tricky, because stars that look very close from Earth could be hundreds to thousands of light-years from one another, merely sitting along the same line of site.
Ruling out a chance alignment requires lots of observing time to confirm that the two candidates are actually at the same distance and moving together. Because of Earth’s motion around the sun, nearby stars appear to change position in the sky, and that parallax can be used to calculate how far away they are. The star’s motion across the sky, known as proper motion, helps determine its velocity.
Gaia conducts this tedious astrometry continuously for all nearby stars in the sky, 24/7, from its orbit at the Earth-Sun Lagrange point. The space telescope’s survey is most useful for stars within about 3,000 light years of Earth, however, because beyond that, the parallax is usually too small to measure.
El-Badry first looked for binary stars in Gaia data after the mission’s second release of star measurements in 2018, with the help of colleagues Hans-Walter Rix, director of the Max-Planck Institute for Astronomy in Heidelberg, Germany, and Tyler Heintz, a graduate student at Boston University. They developed computational techniques to identify stars moving together through space and at the same distance from Earth. The technique basically projects each star’s movement over thousands of years, based on its proper motion today, and pulls out stars that are moving in the same direction. If they also turn out to be at the same distance based on parallax, they’re probably bound to one another, he said.
He and his colleagues focus primarily on wide-binaries—those separated by a distance of 10 AU (astronomical units) or more—that is, 10 or more times the distance between Earth and the sun (93 million miles). Stars closer than that typically appear as one point of light and require other spectroscopic techniques to distinguish whether they are true binaries.
https://scx2.b-cdn.net/gfx/video/2021/binarystarsa.mp4A projection into the future of the motions of binary star pairs near our sun. Credit: Animation by Jackie Faherty, AMNH, based on data by Kareem El-Badry, UC Berkeley
To get first crack at Gaia’s latest data, El-Badry arose at 3 a.m. on the release date, Dec. 3 of last year, and joined some 100 other astronomers from around the world on Zoom. He quickly ran pre-programmed queries on the data to extract the catalog information he needed to create the 3-D map.
The initial queries returned some 1.8 million binary candidates from Gaia’s catalog of 1.8 billion stars, so El-Badry first had to assess the likelihood that some of the pairs were at the same distance and moving in similar directions just by chance, not because they are paired. He estimates that nearly 1.3 million pairs had at least a 90% chance of being bound, and 1.1 million had a 99% chance.
“About half of all sun-like stars are binaries, many of them too close to distinguish, but we find something like 25% of all sun-like stars have a binary companion at separations of more than 30 AU, about the distance to Pluto,” he said. “The distribution peaks at a separation of 30 or 50 AU.”
Some pairs are separated by as much as a parsec—260,000 AU, or 3.26 light years—though most are within 1,000 AU of one another.
One takeaway, he said, is that the new analysis confirms something hinted at in the 2018 data: Many binary star pairs are very similar in mass.
“One thing we already found that is cool—we discovered this with Gaia DR2, but now we can study it better with this sample—is that binaries like to be identical twins,” he said. “That is really weird, because most of these are separated by hundreds or thousands of AU, so they are so far apart that, by conventional star formation theories, their masses should be random. But the data tells a different story: They know something about their companions’ masses.”
The implication, he said, is that they formed much closer together in a process that tended to equalize their masses and then migrated apart, perhaps because of interactions with other nearby stars.
The compilation of binary stars also allowed El-Badry to check the reported uncertainties in Gaia’s measurements of stellar positions, which can assist other researchers who use the data.
White dwarf atmospheres might contain the pulverized crusts of their dead planets
More information:
Kareem El-Badry et al, A million binaries from Gaia eDR3: sample selection and validation of Gaia parallax uncertainties, Monthly Notices of the Royal Astronomical Society (2021). DOI: 10.1093/mnras/stab323
Provided by
University of California – Berkeley
Citation:
Binary stars are all around us, new map of solar neighborhood shows (2021, February 22)
retrieved 23 February 2021
from https://phys.org/news/2021-02-binary-stars-solar-neighborhood.html
This document is subject to copyright. Apart from any fair dealing for the purpose of private study or research, no
part may be reproduced without the written permission. The content is provided for information purposes only.
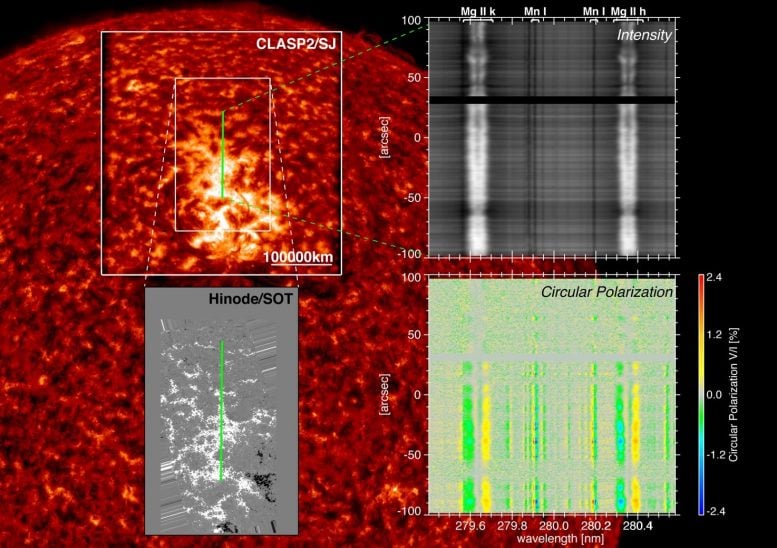
Artistic visualization of the Sun’s magnetic field in the active region observed by CLASP2. Credit: Gabriel Pérez Díaz, SMM (IAC)
Every day space telescopes provide spectacular images of the solar activity. However, their instruments are blind to its main driver: the magnetic field in the outer layers of the solar atmosphere, where the explosive events that occasionally affect the Earth occur. The extraordinary observations of the polarization of the Sun’s ultraviolet light achieved by the CLASP2 mission have made it possible to map the magnetic field throughout the entire solar atmosphere, from the photosphere until the base of the extremely hot corona. This investigation, published today in the journal Science Advances, has been carried out by the international team responsible for this suborbital experiment, which includes several scientists of the POLMAG group of the Instituto de Astrofísica de Canarias (IAC).
The chromosphere is a very important region of the solar atmosphere spanning a few thousand kilometers between the relatively thin and cool photosphere (with temperatures of a few thousand degrees) and the hot and extended corona (with temperatures above a million degrees). Although the temperature of the chromosphere is about one hundred times lower than that of the corona, the chromosphere has a far higher density, and thus much more energy is required to sustain it. Moreover, the mechanical energy necessary to heat the corona needs to traverse the chromosphere, making it a crucial interface region for the solution of many of the key problems in solar and stellar physics. One of the current scientific challenges is to understand the origin of the violent activity of the solar atmosphere, which on some occasions perturb the Earth’s magnetosphere with serious consequences for our present technological world.
The red colored image, obtained with NASA’s SDO telescope, shows the active region simultaneously observed by CLASP2 and Hinode. The green lines on the left panels show the slit position of the CLASP2 spectropolarimeter. At each point on the slit, CLASP2 measured the wavelength variation of the intensity (upper right panel) and circular polarization (lower right panel) of various chromospheric lines of the solar ultraviolet spectrum. At the same time, the circular polarization of photospheric lines in the visible spectral range was measured by the space telescope Hinode. Such circular polarization signals arise from the magnetic fields present at different heights in the solar atmosphere and, from them, the researchers were able to determine how the magnetic field varies from the photosphere to the base of the corona. Credit: NAOJ, IAC, NASA/MSFC, IAS
“It is impossible to understand the solar atmosphere if we cannot determine the magnetic fields of the chromosphere, especially in its outer layers where the plasma temperature is of the order of ten thousand degrees and the magnetic forces dominate the structure and dynamics of the plasma,” says Javier Trujillo Bueno, CSIC Professor at the IAC and lead scientist of the POLMAG group of the IAC. The theoretical investigations carried out by this group, funded by an Advanced Grant of the European Research Council, indicated that this goal could be reached by observing the polarization that various physical mechanisms produce in the radiation emitted by neutral hydrogen and ionized magnesium atoms in the solar chromosphere.
Because the Earth’s atmosphere strongly absorbs the solar ultraviolet radiation, one must go to observe it at altitudes above 100 kilometers. An international consortium was established with this goal, led by the NASA Marshall Space Flight Center (NASA/MSFC), the National Astronomical Observatory of Japan (NAOJ), the French Institute of Space Astrophysics (IAS) and the Spanish Instituto de Astrofísica de Canarias (IAC). This international team designed a series of space experiments that were selected through competitive calls within the Sounding Rocket Program of NASA. These space experiments are known as CLASP, the “Chromospheric Lyman-Alpha Spectro-Polarimeter” (CLASP1, launched on the 3rd of September 2015) and the “Chromospheric LAyer Spectro-Polarimeter” (CLASP2, launched on the 11th of April 2019). Both experiments were a great success, which NASA has acknowledged by granting the “Group Achievement Honor Award” to the international team.
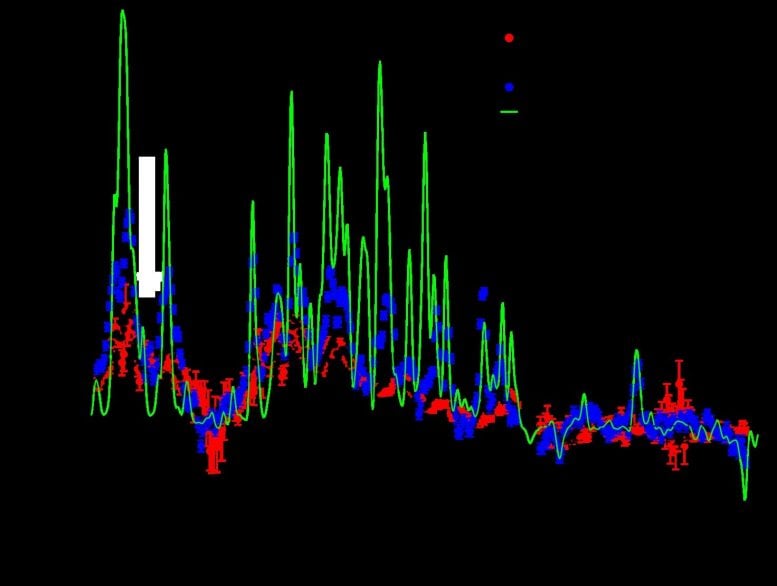
Longitudinal component of the magnetic field (in gauss) at each point along the spatial direction indicated by the green line in the left panels of figure 1. The strongest and weakest magnetic fields are found in the photosphere (green curve), where there are strongly magnetized regions (up to 1250 gauss) separated by others that are weakly magnetized (10 gauss). This substantial variation in the magnetic field intensity when moving horizontally in the photosphere decreases at heights corresponding to the lower chromosphere (blue symbols) and is even smaller in the intermediate (black symbols) and outer (red symbols) layers of the chromosphere. These results confirm and prove that, in such active regions of the solar atmosphere, the lines of force of the magnetic field expand and fill the whole chromosphere before reaching the base of the corona. Credit: NAOJ, IAC, NASA/MSFC, IAS
The research paper recently published in the prestigious journal Science Advances is based on a small part of the unprecedented data acquired by CLASP2. The team analyzed the intensity and the circular polarization of the ultraviolet radiation emitted by an active region of the solar atmosphere in the spectral range containing the h & k lines of Mg II (ionized magnesium) around 2800 Å (see figure 1). Within this spectral region there are also two spectral lines produced by Mn I (neutral manganese) atoms.
The circular polarization observed by CLASP2 arises from a physical mechanism known as the Zeeman effect, through which the radiation emitted by atoms in the presence of a magnetic field is polarized. “The circular polarization signals of the magnesium (Mg II) lines are sensitive to the magnetic fields in the middle and outer regions of the solar chromosphere, whereas the circular polarization of the manganese (Mn I) lines responds to the magnetic fields in the deepest regions of the chromosphere,” explains Tanausú del Pino Alemán, one of the scientists of the POLMAG group and of the international team.
While CLASP2 was carrying out its observations, the Hinode space telescope was simultaneously pointing at the same active region on the solar disk. “This made it possible to obtain information about the magnetic field in the photosphere through the polarization observed in neutral iron (Fe I) spectral lines of the visible range of the spectrum,” notes Andrés Asensio Ramos, another IAC researcher who participated in the project. The team also made simultaneous observations with the IRIS space telescope, measuring the intensity of the ultraviolet radiation with higher spatial resolution (IRIS was not designed to measure polarization).
The team’s investigation, led by Dr. Ryohko Ishikawa (NAOJ) and Dr. Javier Trujillo Bueno (IAC), allowed to map for the first time the magnetic field in the active region observed by CLASP2 throughout its entire atmosphere, from the photosphere to the base of the corona (see figure 2). “This mapping of the magnetic field at various heights in the solar atmosphere is of great scientific interest, as it will help us decipher the magnetic coupling between the different regions of the solar atmosphere,” comments Ernest Alsina Ballester, a researcher of the international team who just joined the IAC after his first postdoc in Switzerland.
The achieved results confirm and prove that, in these regions of the solar atmosphere, the lines of force of the magnetic field expand and fill the whole chromosphere before reaching the base of the corona. Another important result of this investigation is that the magnetic field strength in the outer layers of the chromosphere is strongly correlated with the radiation intensity at the center of the magnesium lines and with the electron pressure in the same layers, revealing the magnetic origin of the heating in the outer regions of the solar atmosphere.
The CLASP1 and CLASP2 space experiments represent a milestone in astrophysics, providing the first observations of the relatively weak polarization signals produced by various physical mechanisms in spectral lines of the solar ultraviolet spectrum. Such observations have spectacularly confirmed previous theoretical predictions, thus validating the quantum theory of the generation and transfer of polarized radiation that these scientists apply in their investigations about the magnetic field in the solar chromosphere.
The international team has just received the good news that NASA has selected their recent proposal to carry out a new space experiment next year, which will allow them to map the magnetic field over larger regions of the solar disk. “Of course, systematic observations of the intensity and polarization of the solar ultraviolet radiation will require a space telescope equipped with instruments like the ones on CLASP, because the few minutes of observation time allowed by a suborbital flight experiment are not sufficient,” clarifies Javier Trujillo Bueno. The team is convinced that, thanks to what CLASP1 and CLASP2 have achieved, such space telescopes will soon become a reality and the physical interpretation of their spectropolarimetric observations will allow for a better understanding of the magnetic activity in the outer layers of the Sun and other stars.
Reference: “Mapping Solar Magnetic Fields from the Photosphere to the Base of the Corona” by Ryohko Ishikawa, Javier Trujillo Bueno, Tanausú del Pino Alemán, Takenori J. Okamoto, David E. McKenzie, Frédéric Auchère, Ryouhei Kano, Donguk Song, Masaki Yoshida, Laurel A. Rachmeler, Ken Kobayashi, Hirohisa Hara, Masahito Kubo, Noriyuki Narukage, Taro Sakao, Toshifumi Shimizu, Yoshinori Suematsu, Christian Bethge, Bart De Pontieu, Alberto Sainz Dalda, Genevieve D. Vigil, Amy Winebarger, Ernest Alsina Ballester, Luca Belluzzi, Jiri Stepan, Andrés Asensio Ramos, Mats Carlsson and Jorrit Leenaarts, 19 February 2021, Science Advances. DOI: 10.1126/sciadv.abe8406
Principal Investigators of the CLASP2 space experiment:
David McKenzie (NASA/MSFC, USA)
Ryohko Ishikawa (NAOJ, Japan)
Frédéric Auchère (IAS, France)
Javier Trujillo Bueno (IAC, Spain)
IAC scientists participating in CLASP2:
Ernest Alsina Ballester (IAC)
Andrés Asensio Ramos (IAC)
Tanausú del Pino Alemán (IAC)
Javier Trujillo Bueno (IAC)
CLASP2 is an international collaboration led by NASA’s Marshall Space Flight Center (USA), the National Astronomical Observatory of Japan (Tokyo, Japan), the Instituto de Astrofísica de Canarias (IAC, Tenerife, Spain) and the Institut d’Astrophysique Spatiale (IAS, France). Additional members are the Istituto Ricerche Solari Locarno (Switzerland), the Astronomical Institute of the Academy of Sciences of the Czech Republic, Lockheed Martin Solar & Astrophysics Laboratory (USA), Stockholm University (Sweden) and the Rosseland Center for Solar Physics (Norway).
The IAC participation in CLASP2 receives funding from the European Research Council (ERC) under the European Union’s Horizon 2020 research and innovation program (Advanced Grant agreement No. 742265).
Scientists have created a new map that aims to identify the best sources of water on Mars.
Water is considered a critical resource to support future exploration activities on Mars. Scientists believe the Red Planet contains large amounts of water. But searching from Earth for the best supplies is not easy.
The American space agency NASA has worked for years to identify the best spots for such water. Most of the water on Mars exists as ice because of extremely cold temperatures.
A new study describes and provides detailed mapping for the most likely areas to contain water ice. The study appeared recently in Nature Astronomy. It is part of a project called Subsurface Water Ice Mapping, or SWIM.
This image, showing two views of the northern hemisphere of Mars, is the result of the study involving researchers at NASA’s Jet Propulsion Laboratory and the Planetary Science Institute in Tucson, Arizona. On the left, the light grey shading shows the no
NASA says the SWIM project combines 20 years of data collected by several of the agency’s Mars explorers. Researchers at the Planetary Science Institute in Tucson, Arizona, are leading the research, with support from NASA’s Jet Propulsion Laboratory in California.
Gareth Morgan is a scientist at the Planetary Science Institute and helped lead the research. He said in a statement, “The goal of SWIM is to provide maps of potential buried ice deposits to support the selection of human landing sites.”
He added that Mars ice is a critical resource that could be used for many things, including providing drinking water for humans, growing plants for food, and producing methane fuel and breathable air. “But the most important is to provide fuel for the return trip home to Earth,” Morgan said.
Researchers have already experimented with methods that could use water ice on Mars to produce fuel, as well as oxygen.
This illustration shows Jezero Crater — the landing site of the Mars 2020 Perseverance rover — as it may have looked billions of years go on Mars, when it was a lake. An inlet and outlet are also visible on either side of the lake. (Image Credit: NASA/JPL
Richard Davis leads NASA’s efforts to find resources on Mars in preparation for sending humans to the Red Planet. He said the identification of water sources on Mars could also help in the search for life, which would likely be found near the water. “The next frontier for Mars is for human explorers to get below the surface and look for signs of microbial life,” Davis said.
NASA says most scientists and engineers believe the most reachable subsurface ice exists below polar areas of Mars in the northern hemisphere. The new map centered on these areas — south of the polar area but north of the equator — because they hold more favorable conditions for humans. Spacecraft landings would also be easier there.
The map identifies two specific areas on Mars where subsurface ice could likely be found. The first sits among plains in an area known as Arcadia Planitia. Scientists believe the area was formed by ancient volcanic flows. The other contains glacier-filled lowlands in an area called Deuteronilus Mensae.
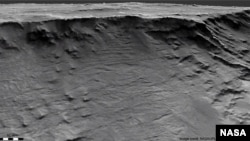
Geological formations are seen in sedimentary rock in the Hellas Basin on Mars. Researchers say these well-exposed channels are archived evidence of long-lived rivers active on the Martian surface over 3.7 billion yrs ago. (HiRISE image/Credit: NASA/JPL-C
The study identified the areas using five different methods that examined datasets from past Mars explorers. They included NASA’s Mars Odyssey, Mars Reconnaissance Orbiter and the Mars Global Surveyor.
The process was not designed to measure water ice directly, Gareth Morgan explained. Instead, it was meant to predict the probability of ice supplies based on observed conditions. He said things such as high levels of hydrogen and high radar-wave speeds can suggest that ice is present. Scientists can also look at the rate at which temperatures change on a surface.
NASA says it plans to use the new research to prepare for discussions with top experts to examine possible human landing areas on Mars.
FILE: Formations made by water and sediment are seen in the Jezero Crater on Mars, a possible landing site for the Mars 2020 Rover, in this false color image taken by NASA, published May 15, 2019 and obtained November 15, 2019. NASA/JPL-Caltech/Handout
NASA also recently announced it had signed an agreement with international partners to develop a future robotic Mars mapping mission to search for water-ice. The partnership includes the space agencies of Italy, Canada and Japan.
Additional mapping efforts in the 2020s “could help make human missions to Mars possible as early as the 2030s,” NASA said. For now, NASA officials plan to keep searching for the best place on Mars to send astronauts so they will have enough local water-ice resources to support their activities.
I’m Bryan Lynn.
Bryan Lynn wrote this story for Learning English, based on reports from NASA, Nature Astronomy and the Planetary Science Institute. Ashley Thompson was the editor.
We want to hear from you. Write to us in the Comments section, and visit our Facebook page.
Quiz – New Map of Mars Water Ice Can Help Identify Best Landing Spots
NASA is teaming up with Elon Musk’s SpaceX on a two-year astrophysics mission to help better understand the birth of the universe and the development of galaxies.
NASA on Thursday revealed it has awarded a contract to SpaceX for the launch of SPHEREx, which stands for Spectro-Photometer for the History of the Universe, Epoch of Reionization, and Ices Explorer.
America is changing faster than ever!Add Changing America to your Facebook or Twitter feed to stay on top of the news.
The spacecraft is due to launch via a SpaceX Falcon 9 rocket in June 2024 from Space Launch Complex-4E at Vandenberg Air Force Base in California. The total cost to launch SPHEREx is about $98.8 million.
NASA says the spacecraft will survey the sky in near-infrared light, which is not visible to the human eye, as a tool to help answer questions about the origins of the universe and how galaxies form.
“It also will search for water and organic molecules – essentials for life as we know it – in regions where stars are born from gas and dust, known as stellar nurseries, as well as disks around stars where new planets could be forming,” NASA said in a news release.
The mission will gather data from more than 300 million galaxies and more than 100 million stars in the Milky Way galaxy.
The contract is the latest NASA has awarded SpaceX over the past several years. SpaceX last year launched astronauts to space for the first time. It was the first privately designed and built spacecraft to launch astronauts to space and the first time NASA had launched its own astronauts since the end of the space shuttle program in 2011.
READ MORE LIKE THIS FROM CHANGING AMERICA
VIRGIN HYPERLOOP TOPS 100 MPH IN SUCCESSFUL FIRST PASSENGER RIDE
ART MUSEUM USES SPECIAL CAMPAIGN BANNERS TO HELP REVERSE AIR POLLUTION
LOUISVILLE WORKING TO DECLARE RACISM A PUBLIC HEALTH CRISIS
ALMOST 100 PERCENT OF AMERICANS POLLED THINK POLICE REFORM IS NEEDED
GOOGLE ANNOUNCES FIRST U.S. OPERATIONS CENTER IN MISSISSIPPI
Microsoft released its annual sustainability report today, and Minecraft developer Mojang decided to turn it into something interactive. Called simply “Sustainable City,” the new Minecraft map is available as a free download in the Minecraft marketplace, and it’s also been added to the game’s educational offshoot.
The map features six included lessons, which Mojang says are “designed to give students a sense of stewardship for the planet.” The lessons cover topics like sustainable food production, water outflow and treatment, and responsible forestry. One lesson tasks players with exploring a home built entirely from sustainable materials; another has them venture to a landfill to learn what happens to non-recyclable materials.
The educational version of Minecraft has been around since 2016, but it has become especially popular of late due to the rise in remote learning. Right now, Microsoft says more than 35 million students and educators are licensed to use the platform.