Tag Archives: inversion

Inversion of key U.S. yield curve slice is a recession alarm

Traders work on the floor of the New York Stock Exchange (NYSE) in New York City, U.S., January 10, 2022. REUTERS/Brendan McDermid/File Photo

Register now for FREE unlimited access to Reuters.com

Register

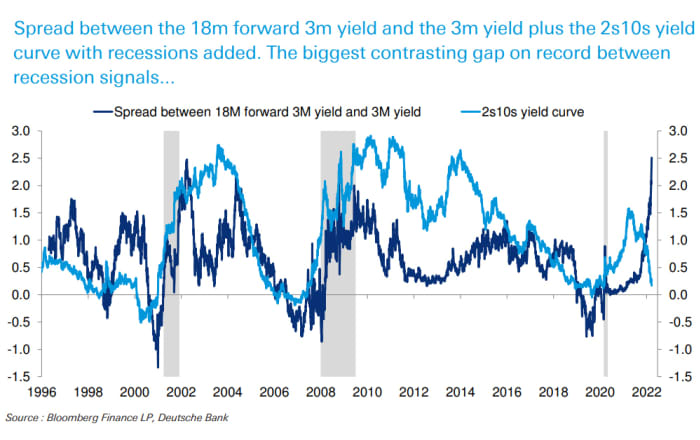
NEW YORK, March 29 (Reuters) – A closely monitored section of the U.S. Treasury yield curve inverted on Tuesday for the first time since September 2019, a reflection of market concerns that the Federal Reserve could tip the economy into recession as it battles soaring inflation.

For a brief moment, the yield on the two-year Treasury note was higher than that of the benchmark 10-year note . That part of the curve is viewed by many as a reliable signal that a recession could come in the next year or two.

The 2-year, 10-year spread briefly fell as low as minus 0.03 of a basis point, before bouncing back above zero to 5 basis points, according to data by Refinitiv.

Register now for FREE unlimited access to Reuters.com

Register

While the brief inversion in August and early September 2019 was followed by a downturn in 2020, no one foresaw the closure of businesses and economic collapse due to the spread of COVID-19.

Investors are now concerned that the Federal Reserve will dent growth as it aggressively hikes rates to fight soaring inflation, with price pressures rising at the fastest pace in 40 years.

“The movements in the twos and the tens are a reflection that the market is growing nervous that the Fed may not be successful in fostering a soft landing,” said Joe Manimbo, senior market analyst at Western Union Business Solutions in Washington.

Western sanctions imposed on Russia after its invasion of Ukraine has created new volatility in commodity prices, adding to already high inflation.

Fed funds futures traders expect the Fed’s benchmark rate to rise to 2.60% by February, compared to 0.33% today. FEDWATCH

Some analysts say that the Treasury yield curve has been distorted by the Fed’s massive bond purchases, which are holding down long-dated yields relative to shorter-dated ones.

Short and intermediate-dated yields have jumped as traders price in more and more rate hikes.

Another part of the yield curve that is also monitored by the Fed as a recession indicator remains far from inversion.

That is the three-month , 10-year part of the curve, which is currently at 184 basis points.

Either way, the lag from an inversion of the two-, 10-year part of the curve to a recession is typically relatively long, meaning that an economic downturn is not necessarily a concern right now.

“The time delay between an inversion and a recession tends to be, call it anywhere between 12 and 24 months. Six months have been the shortest and 24 months has been the longest so it’s really not something that is actionable for the average folks,” said Art Hogan, chief market strategist at National Securities in New York.

Meanwhile, analysts say that the U.S. central bank could use roll-offs from its massive $8.9 trillion bond holdings to help re-steepen the yield curve if it is concerned about the slope and its implications.

The Fed is expected to begin reducing its balance sheet in the coming months.

Register now for FREE unlimited access to Reuters.com

Register

Reporting by Chuck Mikolajczak and Karen Brettell; Additional reporting by John McCrank; Editing by Alden Bentley and Nick Zieminski

Our Standards: The Thomson Reuters Trust Principles.

Read original article here

Stock-market investors should watch this part of the yield curve for the ‘best leading indicator of trouble ahead’

Investors have been watching the U.S. Treasury yield curve for inversions, a reliable predictor of past economic downturns.

They don’t always agree on which part of the curve is best to watch though.

“Yield curve inversion, and flatting, has been at the forefront for everyone,” said Pete Duffy, chief investment officer at Penn Capital Management Company, in Philadelphia, by phone.

“That’s because the Fed is so active and rates suddenly have gone up so quickly.”

An inversion of the yield curve happens when rates on longer bonds fall below those of shorter-term debt, a sign that investors think economic woes could lie ahead. Fears of an economic slowdown have been mounting as the Federal Reserve starts to tighten financial conditions while Russia’s Ukraine invasion threatens to keep key drivers of U.S. inflation high.

Lately, the attention has been on the 10-year Treasury yield
TMUBMUSD10Y,
2.478%
and shorter 2-year yield, where the spread fell to 13 basis points on Tuesday, up from a high of about 130 basis points five months ago.

Read: The yield curve is speeding toward inversion — here’s what investors need to know

But that’s not the only plot on the Treasury yield curve investors closely watch. The Treasury Department sells securities that mature in a range from a few days to 30 years, providing a lot of plots on the curve to follow.

“The focus has been on the 10s and 2s,” said Mark Heppenstall, chief investment officer at Penn Mutual Asset Management, in Horsham, Penn, a northern suburb of Philadelphia.

“I will hold out until the 10s to 3-month bills inverts before I turn too negative on the economic outlook,” he said, calling it “the best leading indicator of trouble ahead.”

Watch 10-year, 3-month

Instead of falling, that spread climbed in March, continuing its path higher since turning negative two years ago at the onset of the pandemic (see chart).

The 3-month to 10-year yield spread is climbing


Bloomberg data, Goelzer Investment Management

“The 3-month Treasury bill really tracks the Federal Reserve’s target rate,” said Gavin Stephens, director of portfolio management at Goelzer Investment Management in Indiana, by phone.

“So it gives you a more immediate picture of if the Federal Reserve has entered a restrictive state in terms of monetary policy and, thus, giving the possibility that economic growth is going to contract, which would be bad for stocks.”

Stocks were lower Friday, but with the S&P 500 index
SPX,
+0.51%
and the Nasdaq Composite Index
COMP,
-0.16%
still up about 1.2% on the week. The three major indexes were 4.5% to 10.1% lower so far in 2022, according to FactSet.

By watching the 10s and 2s
TMUBMUSD02Y,
2.280%
spread, “You are looking at the expectations of where Fed Reserve interest rate policy is going to be over a period of two years,” Stephens said. “So, effectively, it’s working with a lag.”

On average, from the time the 10s and 2s curve inverts, until “there’s a recession, it’s almost two years,” he said, predicting that with unemployment recently pegged around 3.8% that, “this curve is going to invert when the economy is really strong.”

The Federal Reserve Bank of San Francisco also called the 3-month
TMUBMUSD03M,
0.535%
and 10-year curve relationship its “preferred spread measure because it has the strongest predictive power for future recessions,” such as in 2019, back when the yield curve was more regularly flashing recession warning signs.

“Did it see COVID coming?” Duffy said, of earlier yield curve inversions.

A more likely catalyst was that investors already were on a recession watch, with the American economy in its longest expansion period on record.

“There are a number of these curves that you need to look at in totality,” Duffy said. “We’ve always said look at many signals.”

Read original article here

The yield curve is speeding toward inversion — here’s what investors need to know

The bond market’s most reliable gauge of the U.S. economic outlook for the past half-century is hurtling toward inversion at a faster pace than it has in recent decades, raising fresh worries about the economy’s prospects as the Federal Reserve begins to consider aggressively hiking interest rates.

The widely followed spread between 2-year
TMUBMUSD02Y,
2.170%
and 10-year Treasury yields
TMUBMUSD10Y,
2.384%
shrank to as little as 13 basis points on Tuesday, a day after Fed Chairman Jerome Powell opened the door to raising benchmark interest rates at more than a quarter percentage point at a time. Though slightly higher on the day as of Tuesday afternoon, the spread is down from as high as 130 basis points last October.

Investors pay close attention to the Treasury yield curve, or slope of market-based yields across maturities, because of its predictive strength. An inversion of the 2s/10s has signaled every recession for the past half-century. That’s true of the early 1980’s recession that followed former Fed Chairman Paul Volcker’s inflation-fighting effort, the early 2000’s downturn marked by the bursting of the dotcom bubble, the 9/11 terrorist attacks, and various corporate-accounting scandals, as well as the 2007-2009 Great Recession triggered by a global financial crisis, and the brief 2020 contraction fueled by the pandemic.

Inversions have already struck elsewhere along the U.S. Treasury curve, suggesting the dynamic is broadening out and could hit the 2s/10s soon. Spreads between the 3-, 5-, and 7-year Treasury yields versus the 10-year, along with the gap between 20-and 30-year yields, are all now below zero.

“The yield curve has the best track record within financial markets of predicting recessions,” said Ben Emons, managing director of global macro strategy
at Medley Global Advisors in New York. “But the psychology behind it is just as important: People begin to factor into their minds interest rates that are perhaps too restrictive for the economy and which could lead to a downturn.”

The following chart, compiled in February, shows how the 2s/10s inverted ahead of past recessions and has continued to flatten this year. The 2s/10s most recently inverted for a brief time in August and September of 2019, just months before a downturn sparked by COVID-19 hit in February to April of the following year.


Source: Clearnomics, Federal Reserve, Principal Global Investors. Data as of Feb. 9, 2022.

Ordinarily, the curve slopes upward when investors are optimistic about the prospects for economic growth and inflation because buyers of government debt typically demand higher yields in order to lend their money over longer periods of time.

The contrary is also true when it comes to a flattening or inverting curve: 10- and 30-year yields tend to fall, or rise at a slower pace, relative to shorter maturities when investors expect growth to cool off. This leads to shrinking spreads along the curve, which can then lead to spreads falling below zero in what’s known as an inversion.

An inverted curve can mean a period of poor returns for stocks and hits the profit margins of banks because they borrow cash at short-term rates, while lending at longer ones.

Though it slightly steepened on Tuesday, the 2s/10s spread is still flattening at a faster pace than it has at any time since the 1980’s and is also closer to zero than at similar points of time during past Fed rate-hike campaigns, according to Emons of Medley Global Advisors. Ordinarily, the curve doesn’t approach zero until rate hikes are well under way, he says.

The Fed delivered its first rate hike since 2018 on March 16, and is now preparing for a 50-basis-point move as soon as May, with Powell saying on Monday that there was “nothing” that would prevent such a move, though no decision had been made yet.

Some market participants are now factoring in a fed-funds rate target that might ultimately get above 3%, from a current level between 0.25% and 0.5%.

Meanwhile, Powell says the yield curve is just one of many things policy makers look at. He also cited Fed research that suggested that spreads between rates in the first 18 months of the curve — which are currently steepening — are a better place to look for “100%” of the curve’s explanatory power.


Sources: Bloomberg, Deutsche Bank

It’s the 2s/10s spread, though, that comes with a proven half-century track record. And it’s fair to say that whenever the spread is about to invert, observers have cast doubt on its predictive capabilities.

Read: Here are three times when the Fed denied the yield curve’s recession warnings, and was wrong (April 2019)

“Usually the yield curve is an excellent look into the not-so-distant future,” said Jim Vogel of FHN Financial. “Right now, however, there are so many things moving at the same time, that its accuracy and clarity have begun to be diminished.”

One factor is “terrible” Treasury market liquidity resulting from the Fed’s move away from quantitative easing, as well as Russia’s invasion of Ukraine, Vogel said via phone. “People are not necessarily thinking. They are reacting. People are not sure what to do, so they’re buying three-year maturities, for example, when typically people are more thoughtful about their choices. And those choices usually go into the accuracy of curve.”

He sees the spread between 3-year
TMUBMUSD03Y,
2.389%
and 10-year yields, which just inverted on Monday after Powell’s comments, as a better predictor than 2s/10s — and says that a sustained inversion of 3s/10s over one or two weeks would lead him to believe a recession is on the way.

On Tuesday, Treasurys continued to sell off sharply, pushing yields higher across the curve. The 10-year rate rose to 2.38%, while the 2-year yield advanced to 2.16%. Meanwhile, U.S. stocks recovered ground as all three major indexes
DJIA,
+0.74%

SPX,
+1.13%

COMP,
+1.95%
rose in afternoon trading.

Read original article here

A ‘firestorm’ of hawkish Fed speculation erupts following strong U.S. inflation reading

How hawkish will the Federal Reserve be this year?

At the moment, Wall Street economists seem to be telling their clients “more hawkish than we thought five minutes ago.”

The strong U.S. consumer inflation data reported Thursday has set off what looks like a chain reaction of upward revisions to projected interest rates rises and where the Fed is headed with monetary policy.

Fed watchers are talking seriously about an “emergency” interest rate hike before the Fed’s next formal meeting on March 16.

The consumer price index rose 0.6% in January, with broad based gains. The year-over-year rate rose to 7.5%, the highest level in 40 years.

Read: Consumer price inflation increases sharply in January

In the wake of the data, Goldman Sachs said it now sees seven consecutive 25 basis point rate hikes at each of the remaining Fed policy meeting this year. The investment bank’s earlier prediction was five hikes.

Economists at Citi said that their base case is a now for a 50 basis point hike in March followed by quarter point hikes in May, June, September and December.

Marc Cabana, head of U.S. rates strategy at BofA Securities, told Bloomberg Radio that it is very likely the Fed is going to raise rates by 50 basis points in March and “who knows, maybe even 50 in May.”

The talk about an inter-meeting rate hike before March 16 erupted late Thursday after St. Louis Fed President James Bullard said was open to having that discussion.

Market analyst Mohamed Ed-Erian said the frenzy of speculation is a sign the Fed has lost control of the policy narrative. He said he didn’t want to see the Fed take aggressive moves because the market will price in aggressive moves again and again.

“This is what typically happens in a developing country when a central bank loses control of the policy narrative,” he said.

March Chandler, forex analyst for Bannockburn Global Forex, said it will be difficult for Fed officials to get ahead of the curve of expectations.

It is a strange time for the Fed. The central bank has been slowly “tapering” or reducing the amount of securities is is buying under its quantitative easing program started in the depth of the pandemic. The buying of Treasurys and mortgage backed securities is scheduled to end in mid-March.

Some Fed watchers think the Fed may decide to end these purchases “cold turkey,” with the announcement coming Friday.

Under the Fed’s QE program, the Fed is scheduled to release its schedule for the last month of asset purchases.

“If the Fed releases that calendar at 3 p.m, it is pretty strong forward guidance they’re not going to do an intermeeting hike,” Cabana said.

Cabana said he didn’t expect a rate hike before the March 16 meeting. He suggested that investors who want to bet on an intermeeting hike would be better positioned to play for a 75 basis point hike in March.

However, Robert Perli, head of global policy at Piper Sandler, said the firestorm among Fed watchers felt like “much ado about little.”

“We are first to recognize that inflation is too high for comfort. But what we learned yesterday from both the CPI report and FOMC members doesn’t seem enough to change the policy outlook nearly as much as the market did,” Perli said, in a note to clients.

Three Fed officials were not as hawkish as Bullard in their comments the wake of the CPI report.

Richmond Fed President Tom Barkin told the Stanford Institute for Economic Policy Research on Thursday evening that he would have to be convinced of a need for a 50 basis point rate hike, Reuters said.

In an interview with Market News International, San Francisco Fed President Mary Daly downplayed the chances of a half-a-percentage point hike in March.

And Atlanta Fed President Raphael Bostic told CNBC after the CPI data that he was sticking with his call for four rate hikes this year, including a 25 basis point hike in March.

Tim Duy, chief U.S. economist at SGH Macro Advisors, called these dovish Fed comments “nonsensical.”

“It is just getting to the point where the distance between the Fed’s current position and reality is too wide to ignore any longer,” Duy said, in a note to clients.

U.S. stocks
DJIA,
-0.17%

SPX,
-0.45%
were mixed late morning Friday after a wild week on Wall Street. The yield on the 10-year Treasury note
TMUBMUSD10Y,
2.024%
stayed above 2%, the highest level since 2019.

Read original article here